What Record Global Debt Means for Investors
“Paper money can see its value evaporate if fiscal folly prevails.”

There are years when very little changes, and periods when several forces shift at once. We are living through the latter.
US Debt Tops $40 Trillion
The US government now owes more than $40 trillion. This year it will spend about $1 trillion just on interest, more than it spends on defence.
The United States is not alone. You may have seen some of these headlines in the last few weeks. “Global debt tops $365 trillion as economists sound alarm over ‘vicious cycle’,” CNBC reported on 24 September. The same day, it reported that a fresh budget battle in France threatens to topple another government. And another headline that week: “30-year Treasury yield hits highest level since 2004.”
$365.5 Trillion and Counting
Total global debt hit a record $365.5 trillion in the first half of 2026, about 310% of world GDP. The world has never owed this much, in absolute terms and as a share of what it earns.
Debt has three layers: what governments owe, what companies owe, and what households owe. Added together, the United States owes about 250% of its GDP, up from 231% in 2007. Other large economies carry more: Japan 349%, France 324% and China 305%. The burden is broad, not confined to one government.
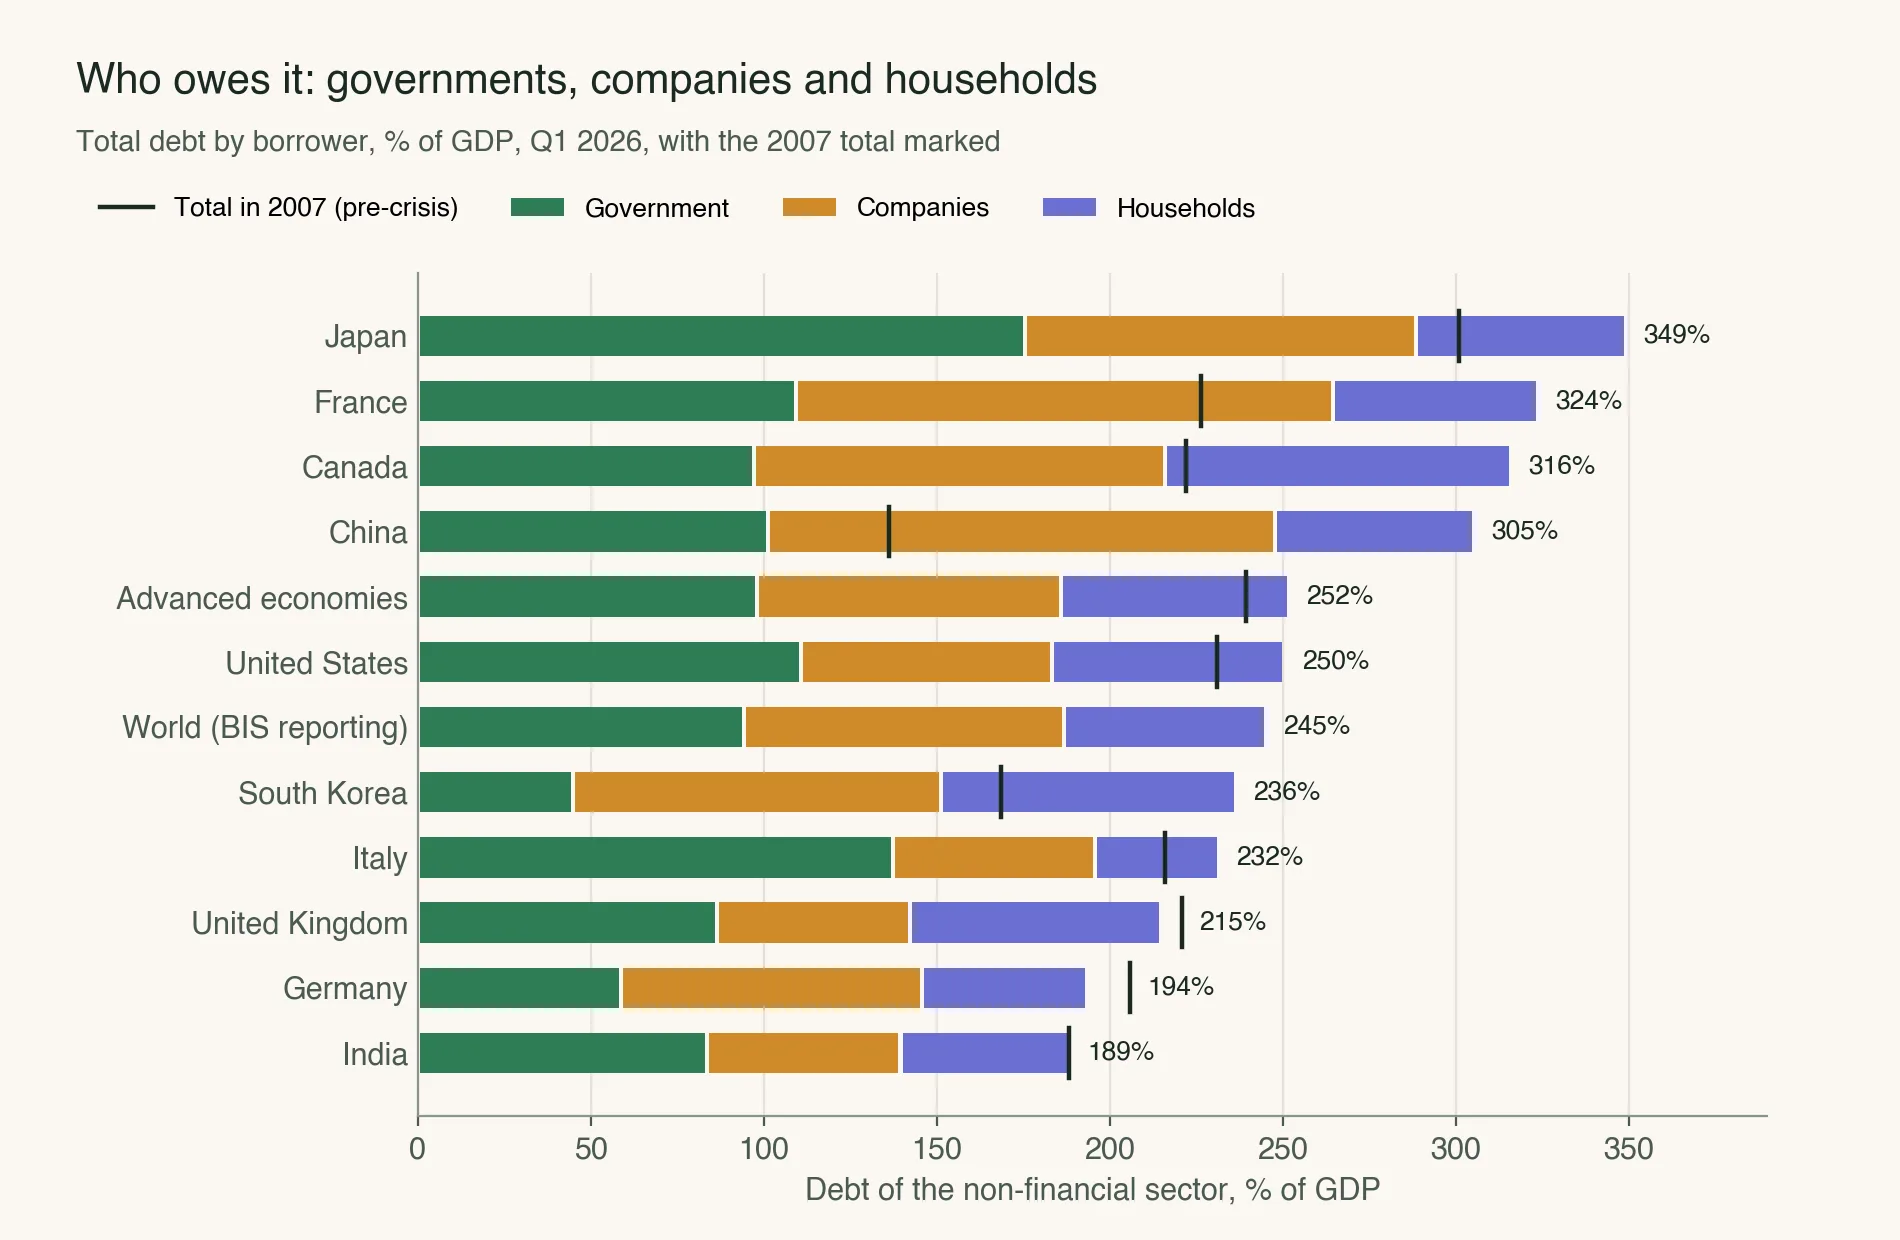
Source: BIS Total Credit Statistics, Q1 2026. Debt of governments, non-financial companies and households, % of GDP.
India sits below the world average. The country’s total debt is 189% of GDP, almost exactly where it was in 2007. India has been more careful than most, but 189% of national income is still a heavy load.
Debt Is Fine. A Debt Crisis Is Not.
Countries have built railways, fought wars and grown rich on borrowed money. Borrowing is healthy when incomes grow faster than the cost of servicing it.
When debts grow faster than incomes, Ray Dalio, founder of Bridgewater Associates, writes that we should “think of it like plaque building up in the arteries.” Too much of it, for too long, ends in a heart attack.
A debt crisis begins when promises exceed the money available to meet them. That is when the question changes from whether debt is useful to who absorbs the loss.
“In the end, the central bank always prints and devalues.”
The economist Adam Smith saw this pattern as early as 1776. “When national debts have once been accumulated to a certain degree, there is scarce, I believe, a single instance of their having been fairly and completely paid,” he wrote in The Wealth of Nations.
The promise may belong to the government, but the cost eventually reaches the people who trusted it.
The Bill Comes Due
Investors pay the bill in four broad ways: default, devaluation, inflation and taxation.
1 Default is the loud way. Greece borrows in euros, a currency it cannot print. In 2012, private holders of Greek government bonds accepted a 53.5% cut to the face value of what they were owed.
Promises that looked safe were halved overnight.
2 Devaluation is quieter. Japan shows how it works.
After its stock and property bubble burst at the end of 1989, Japan’s government borrowed heavily to support the economy. Its debt rose from about 55% of GDP in 1990 to more than 200% today. Japan has not defaulted since the years just after the Second World War. Instead, its central bank bought the debt, and by 2023 it owned more than half of all Japanese government bonds.
The cost showed up in the currency. The yen fell from about 87 to the US dollar at the end of 2012 to about 158 today.
A Japanese family that held the same yen since then now finds it worth about 45% less in dollars, and about 78% less in gold in 14 years.
No default. No crisis. The saver paid anyway.
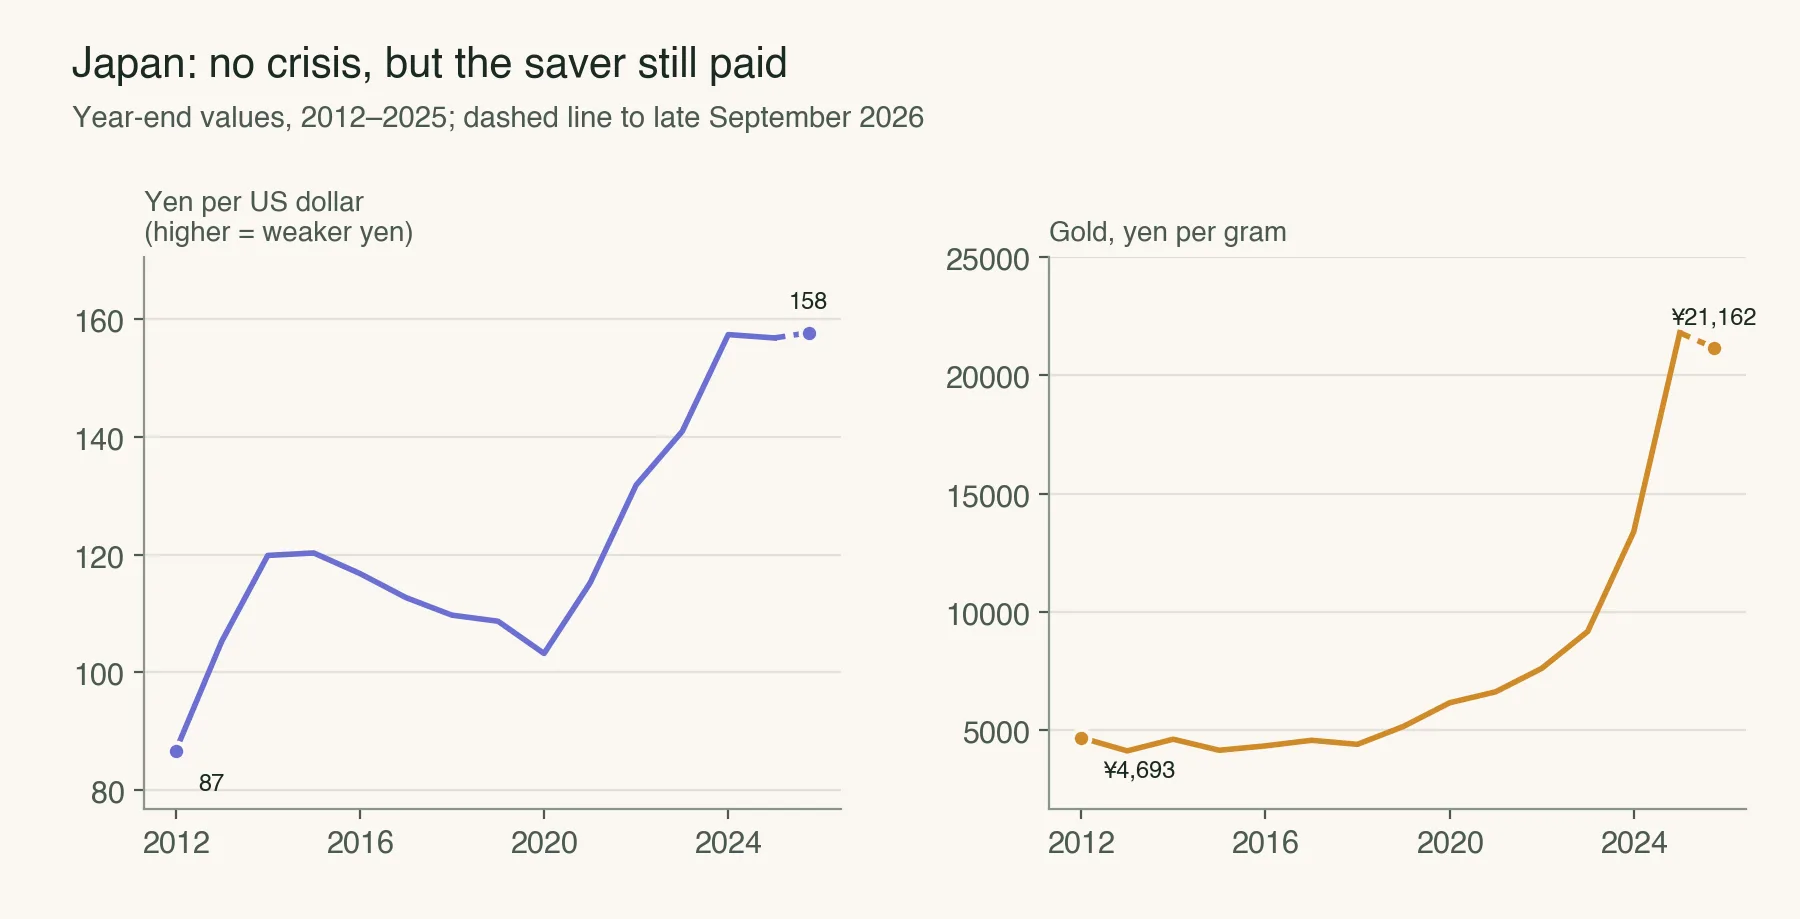
Source: US Federal Reserve (USD/JPY) via FRED; World Bank Pink Sheet and market prices (gold). Gold in yen is calculated.
3 Inflation is the slowest way, and the one everyone feels.
The US dollar is the world’s reserve currency. Central banks hold about 57% of their foreign-currency reserves in dollars, far more than in any other currency. That gives America a privilege no other country has: it borrows in money it can print itself.
But printing has a cost.
Since 2008, the US Federal Reserve has created money on a large scale to buy bonds, known as quantitative easing, four times. The biggest round came with Covid.
The Fed’s balance sheet more than doubled in two years, from about $4.2 trillion to $9.0 trillion.
The US money supply grew 27% in the single year to February 2021.
And after a pause, the Fed began buying government debt again in December 2025, though it calls these purchases routine liquidity management, not stimulus.
Over time, the cost shows up in what a dollar buys. A dollar from 1966 buys about 10 cents’ worth of goods today. That is a 90% loss of purchasing power in 60 years.
Measured in gold, the fall is starker still. An ounce of gold cost $35 in 1966. Today it costs about $4,150.
The economist John Maynard Keynes saw it in 1919: “By a continuing process of inflation, governments can confiscate, secretly and unobserved, an important part of the wealth of their citizens.”
4 Taxation is what governments reach for when things go badly wrong.
Britain came out of the Second World War owing about 270% of its GDP.
Taxes on the highest earners stayed punishingly high for decades. During the war, the top rate on income from investments reached 99.25%. From 1941 to 1979, Britain’s top income-tax rate never fell below 75%.
In the late 1970s, a top earner kept 17 pence of every extra pound earned from work, and just 2 pence of every extra pound from savings and investments.
The Beatles wrote a song about it, “Taxman”. The Rolling Stones moved to France to escape it.
When Trust Breaks
Global debt has grown at an unprecedented pace, and it is not slowing.
Since 2007, the fastest-growing layer across advanced economies has been government debt, and the IMF expects government debt alone to pass 100% of world GDP by 2029, a level last seen just after the Second World War.
Debt is ultimately a promise about the future. Governments borrow against future tax receipts, future growth and future confidence in their currencies.
As promises pile up, trust becomes both more valuable and more fragile. The bill does not disappear when a government prints, inflates, devalues, taxes or defaults. It changes hands. It reaches the people who saved in that currency or bought that promise.
Also from Accrue: Read Part 1: Playing Musical Chairs with Your Wealth

Written by
Devashish Arora
Managing Partner, Accrue · Ex‑Citibank · Engineer · Delhi School of Economics · 10+ Years
View profile on LinkedIn →This article discusses general market history and macroeconomic trends only. It does not recommend, endorse, or advise on any specific security, stock, mutual fund scheme, or investment strategy, including any asset class, country or instrument named here for illustration. Past performance is not indicative of future returns. Mutual fund investments are subject to market risks; please read all scheme-related documents carefully. Accrue is an AMFI-registered Mutual Fund Distributor (ARN 162637), not an investment adviser. For personalised advice, please consult a SEBI-registered investment adviser.
Sources
- Institute of International Finance, Global Debt Monitor (Sep 2026).
- BIS Total Credit Statistics (Q1 2026).
- IMF World Economic Outlook and Fiscal Monitor (2026).
- IMF COFER, currency composition of official foreign-exchange reserves.
- US Treasury, Debt to the Penny.
- Congressional Budget Office.
- US Federal Reserve via FRED: balance sheet (WALCL), M2 money stock (M2SL), CPI (CPIAUCSL), 30-year Treasury yield (DGS30).
- Federal Reserve Bank of New York, Statement Regarding Reserve Management Purchases Operations (10 Dec 2025).
- CNBC (24 Sep 2026): "Global debt tops $365 trillion...", "France's fresh budget battle...", "30-year Treasury yield hits highest level since 2004".
- World Bank, Commodity Markets (Pink Sheet).
- Ray Dalio, How Countries Go Broke (2025).
- Warren Buffett, 2024 Berkshire Hathaway shareholder letter.
- Adam Smith, The Wealth of Nations (1776).
- John Maynard Keynes, The Economic Consequences of the Peace (1919).
- Zettelmeyer, Trebesch and Gulati, "The Greek Debt Restructuring: An Autopsy" (CEPR DP9577 / Economic Policy, 2013).
- Tax Policy Associates (UK), on WWII/1970s UK top income-tax rates.