Is the AI Bubble Bursting? October's Sell-Off and the Question of AI Earnings
“Nothing sedates rationality like large doses of effortless money.”
Tech stocks fell hard in October, in the US, China and Korea. Zoom out, and the bigger story is how much expectation was already built into prices.
For information and education only. Not investment advice, and not research for the purpose of investment.
October prompted a reassessment across financial markets, with investors asking whether the AI bubble is bursting. Technology equities declined sharply worldwide, spanning exchanges from New York to Seoul and Hong Kong.
The October drop
The Nasdaq 100 index declined by 6.7% in October. Prominent AI companies experienced steeper retracements. Alphabet, Meta and Nvidia all recorded substantial losses.
The decline occurred in two phases. By mid-month, equities had slipped. Interest rates remained elevated and markets anticipated a further Federal Reserve rate hike.
The second phase followed corporate earnings reports. These releases detailed the substantial costs required to build AI infrastructure. Although revenues increased, extensive capital expenditure weighed heavily on cash flow. Alphabet reported negative free cash flow—the cash left after paying for operations and equipment—of $9.1 billion for the quarter. Amazon recorded negative free cash flow of $42.4 billion over a 12-month period.
Meta similarly experienced negative cash flow and began selling shares to raise capital. Concurrently, Microsoft and Google reportedly refrained from increasing their future spending projections.
This selling pressure extended globally. In Korea, which hosts major memory-chip manufacturers, the Kospi index fell sharply as local media questioned the financial returns on AI capital expenditure. Hong Kong’s technology index also declined, extending a longer-term downward trend.
Before judging whether the bubble is bursting, it helps to zoom out.
Zoom out: what was already baked into prices
Before assessing the risks, it is worth asking what prices already reflected. By early October, the premium paid by investors was substantial.
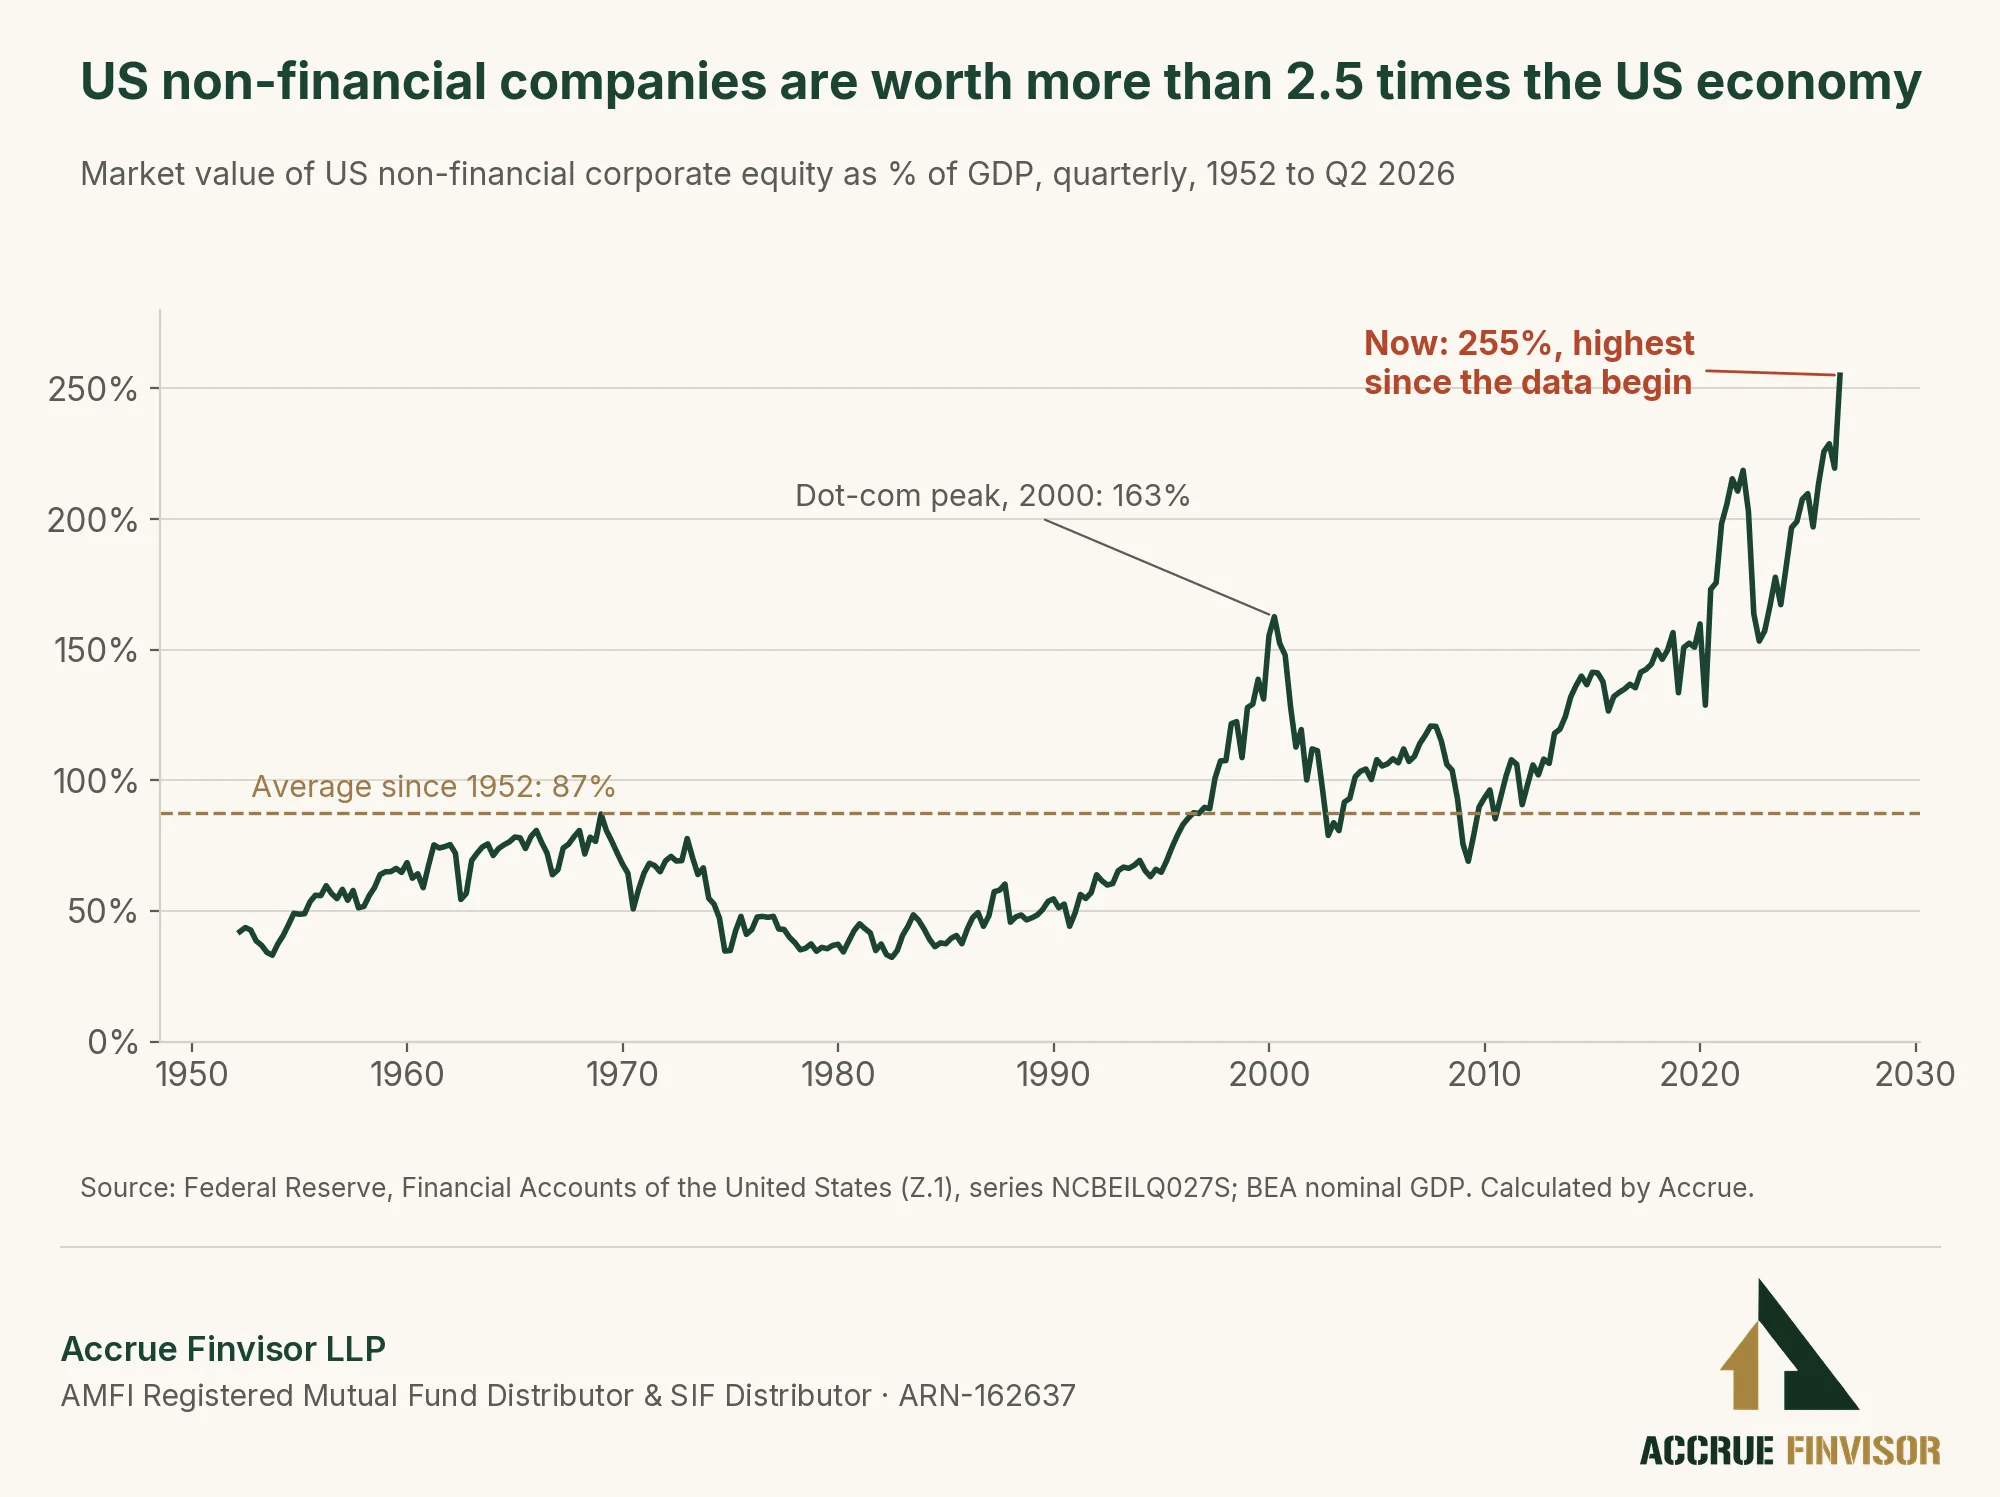
The total market capitalisation of US non-financial companies reached 255% of US gross domestic product. This is the highest in Federal Reserve data. At the peak of the dot-com boom in 2000, the equivalent figure was only 163%.
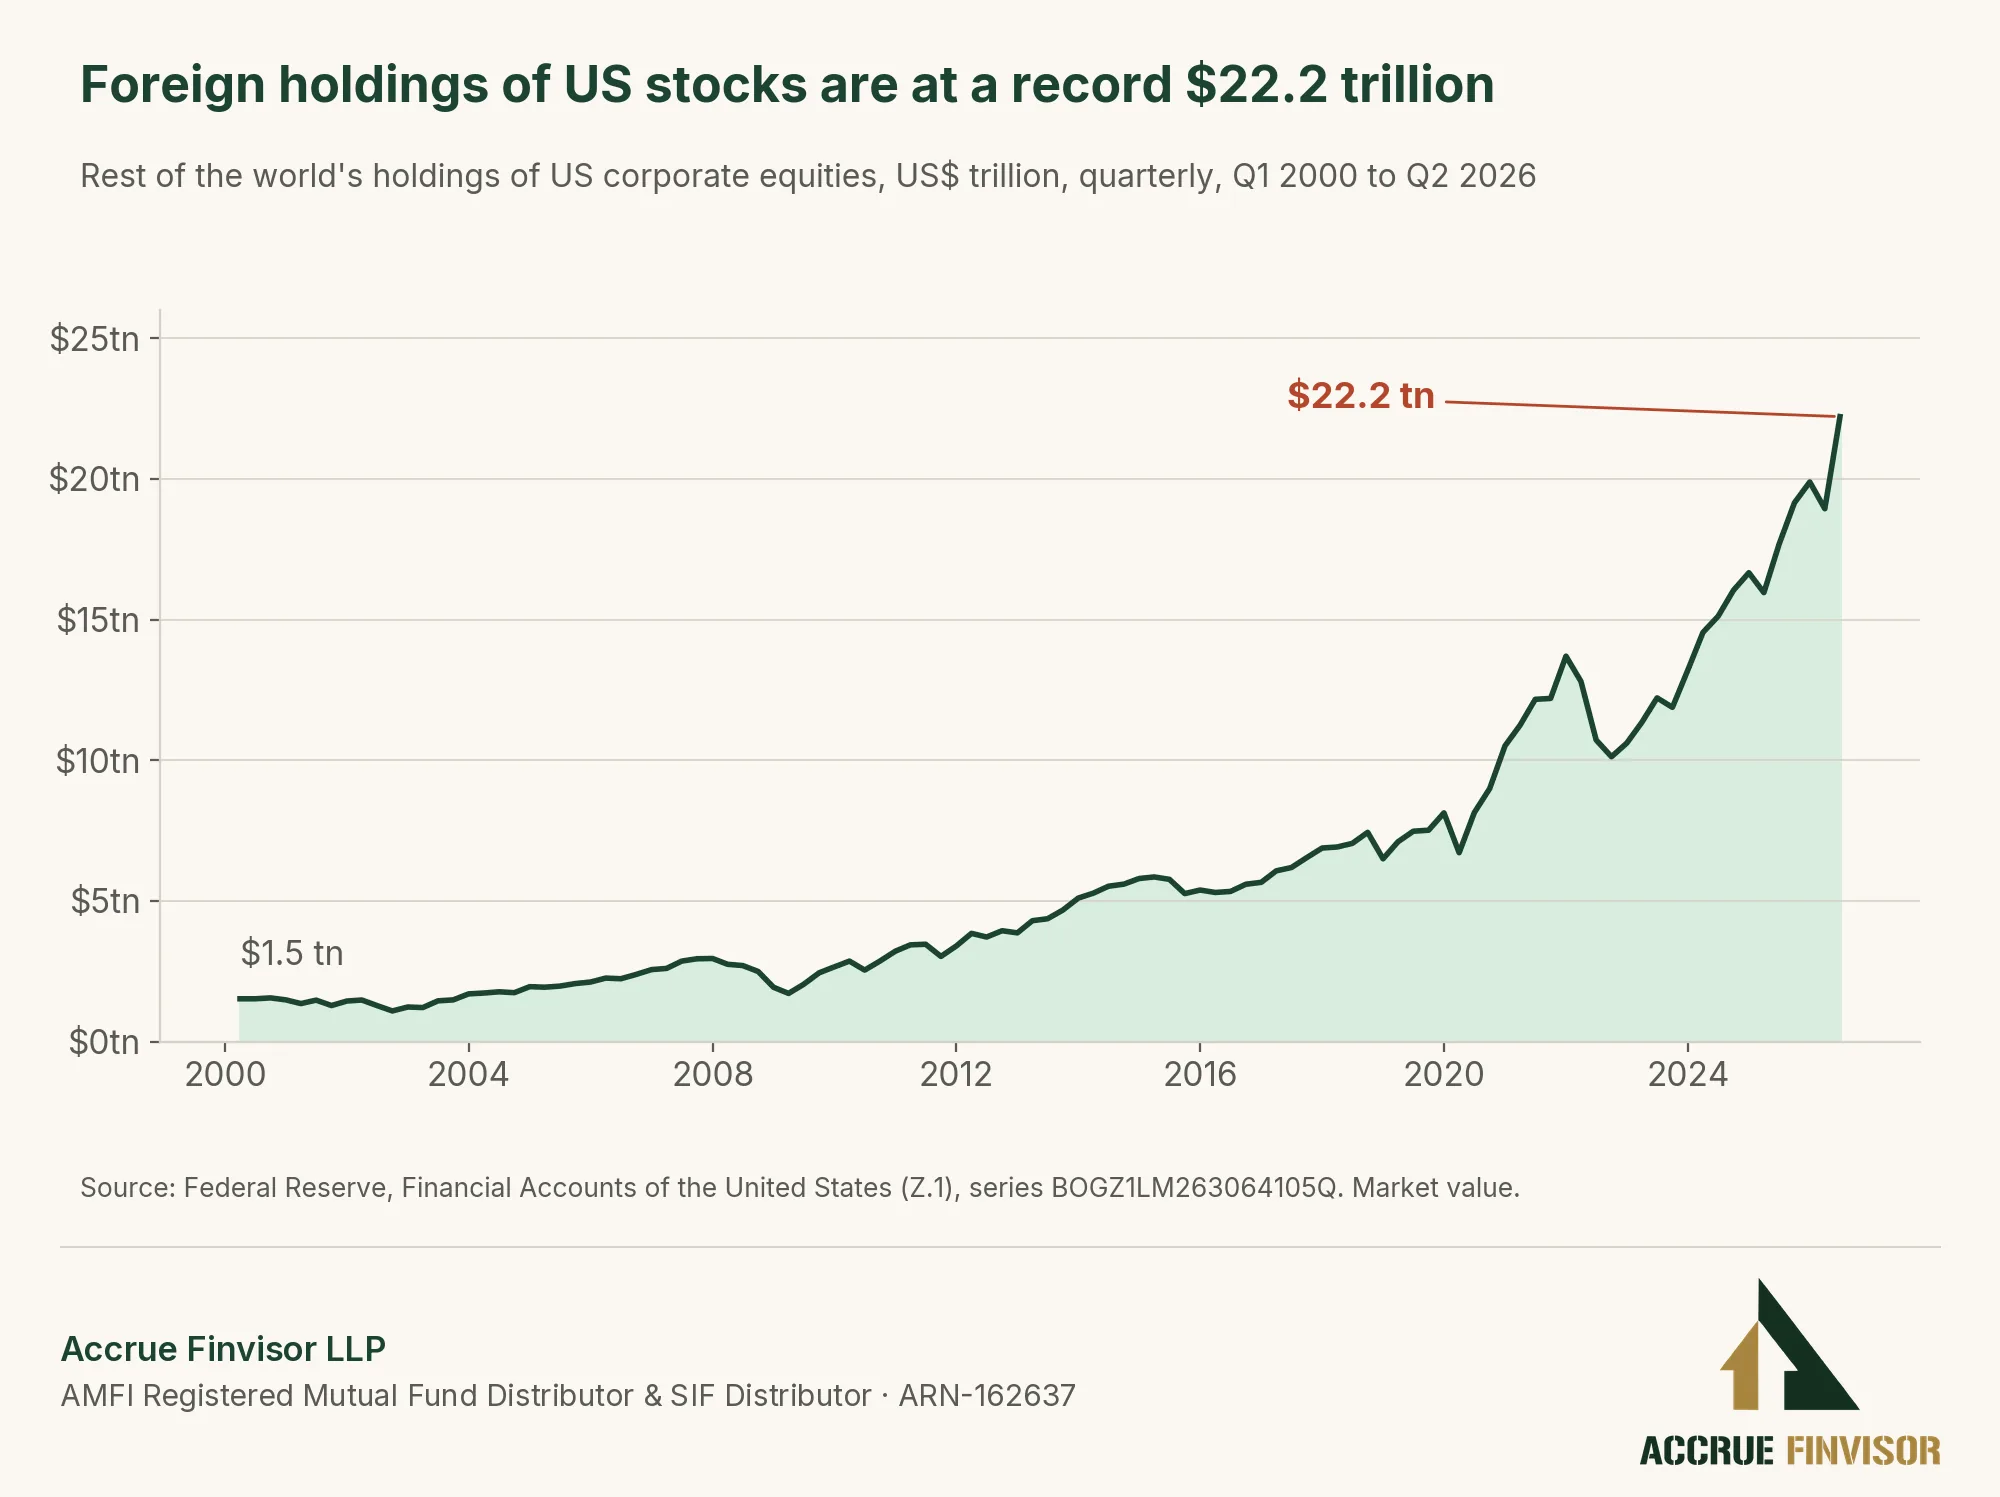
Global savings remain highly concentrated in the American equity market. Foreign investors held a record $22.2 trillion in US equities in mid-2026. The US is 64% of the world stock market index (MSCI ACWI), while US GDP is only about 25% of world GDP.
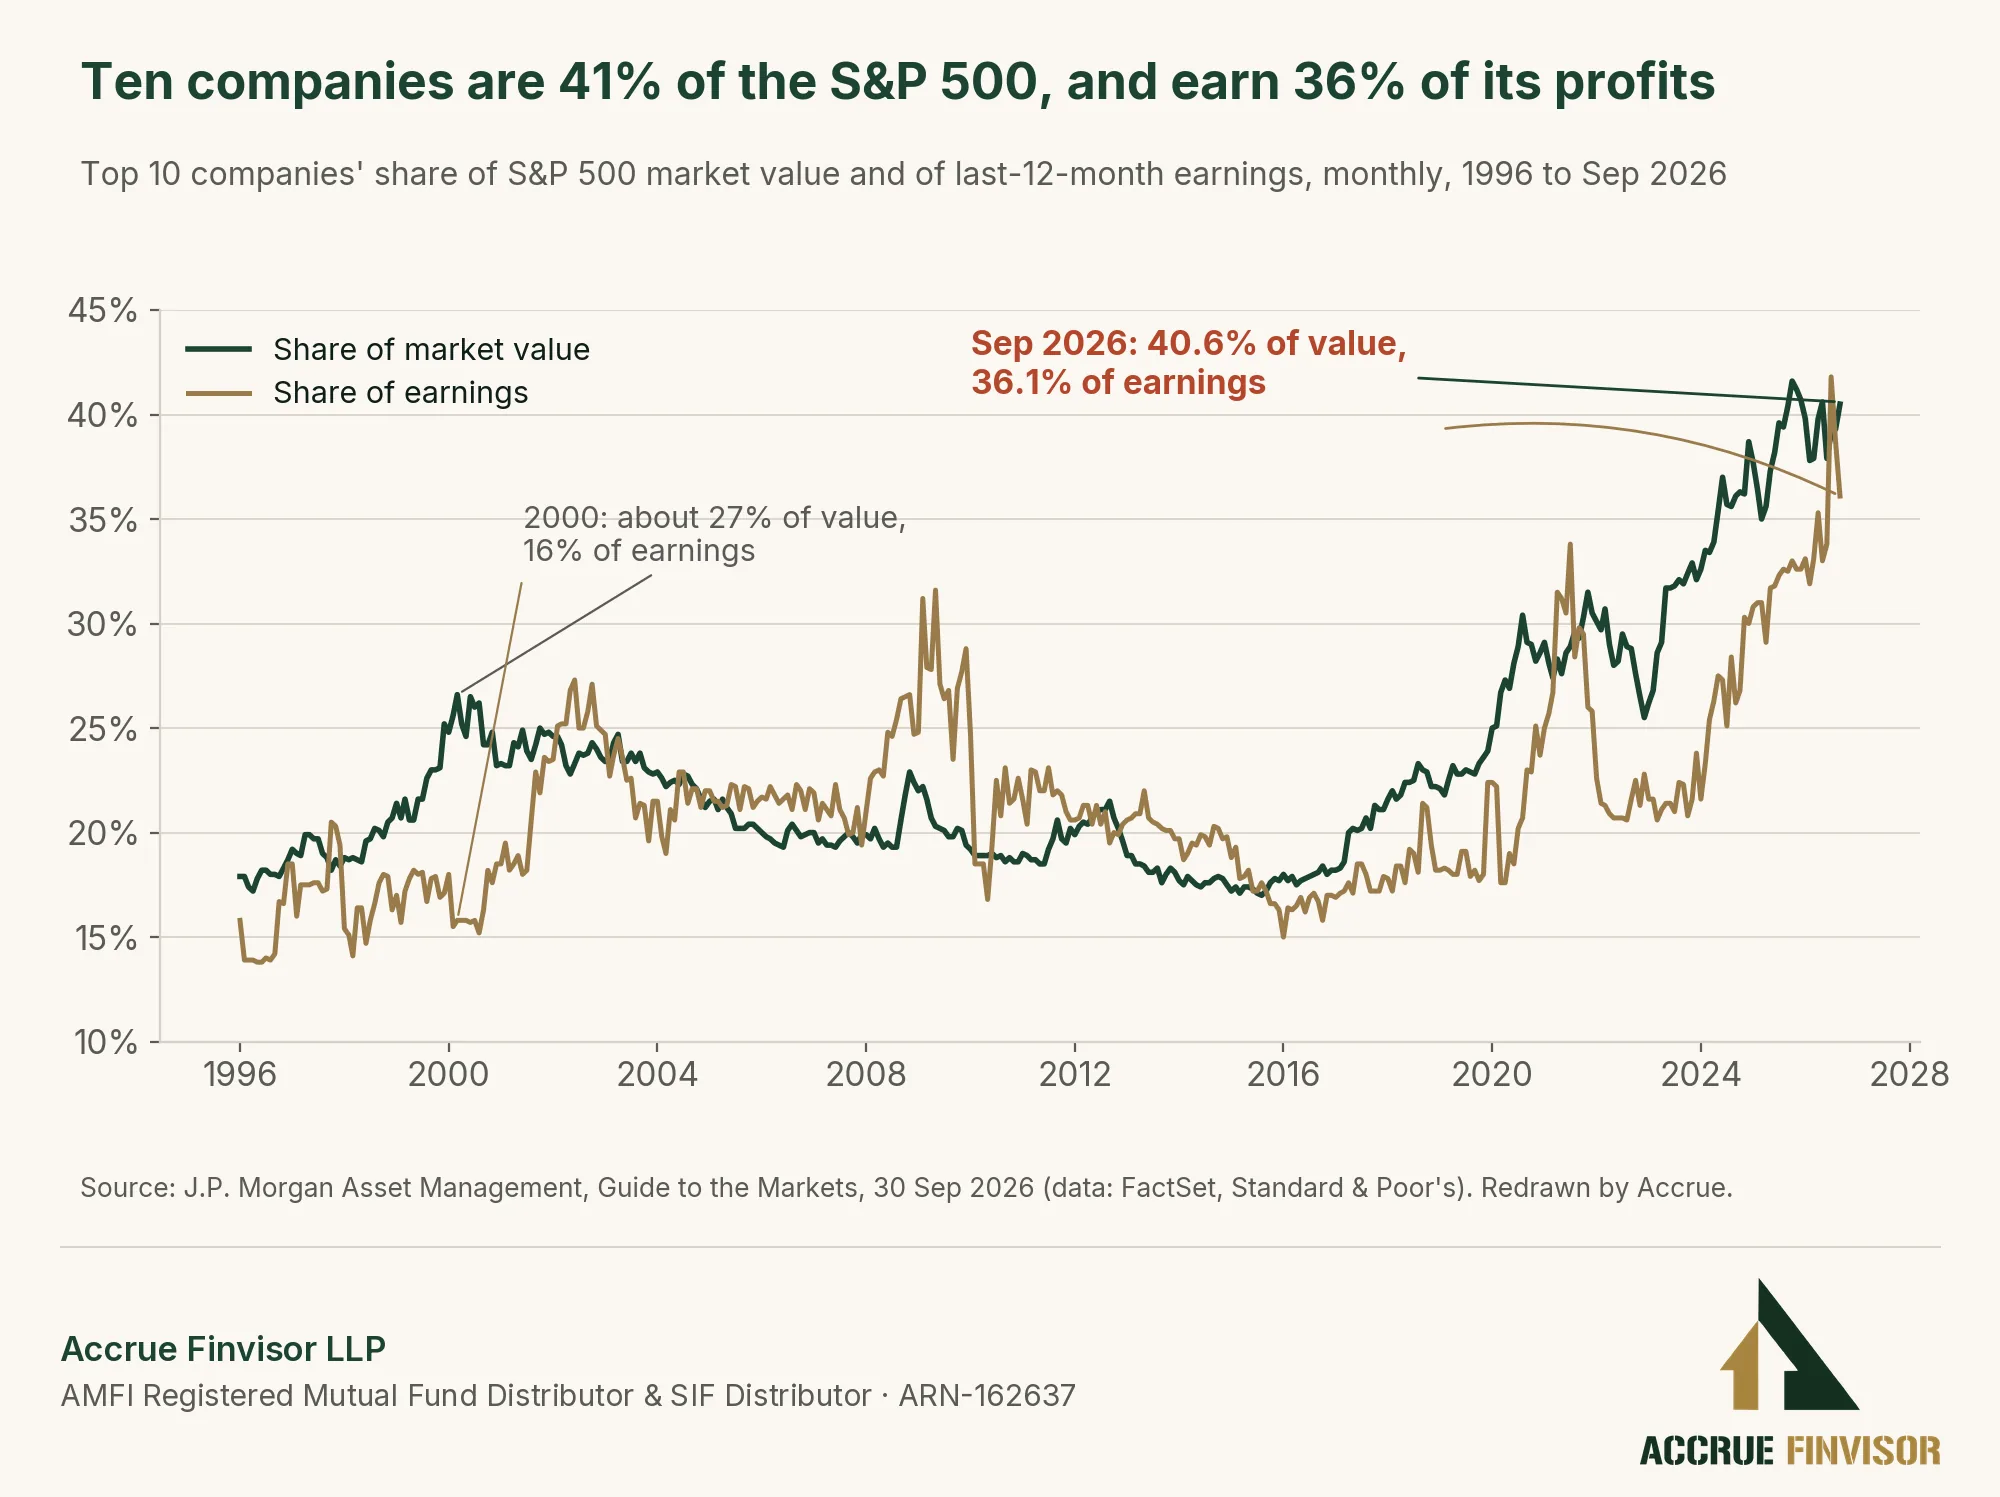
The US market exhibits similar concentration internally. By the end of September, ten companies accounted for 40.6% of the S&P 500 index’s total value. This is near a record in J.P. Morgan’s data. These companies’ proportionate share of the index’s profits has also risen steeply.
Prices assumed fast growth
Equity valuations reflect forward expectations. Investors are currently paying a multiple of 25.9 times recent earnings for the S&P 500. Against the earnings expected over the next 12 months, the multiple is close to its 10-year average, according to FactSet. This disparity indicates that the market is pricing in substantial profit growth.
Analysts project the index’s aggregate earnings will rise by 32.9% in 2026. Jefferies estimates that AI-related companies globally will roughly double their earnings this year, significantly outpacing other businesses. A chart from Kotak Mutual Fund shows the gap: 96.5% against 16.4% this year.
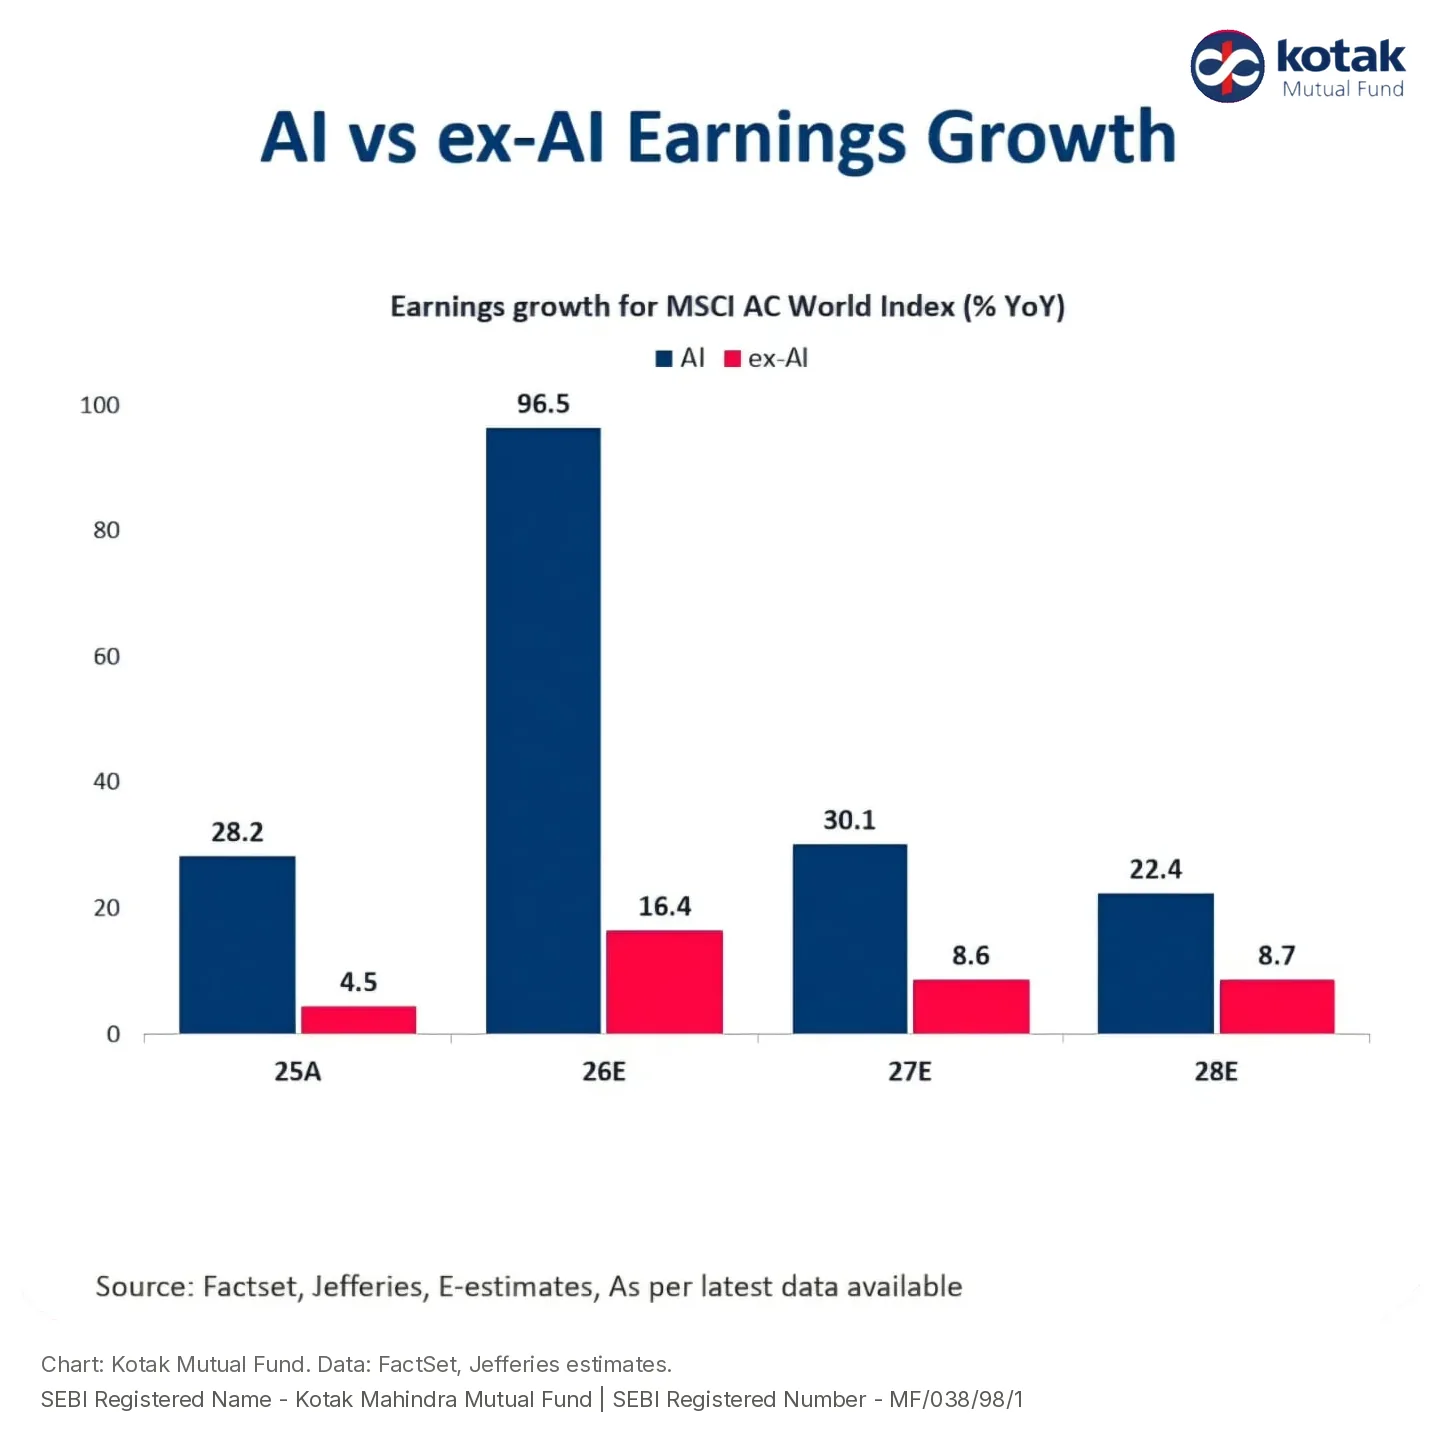
Given these elevated growth expectations, October’s earnings reports prompted a negative market reaction. This occurred despite rapid growth in the cloud computing divisions of Google, Amazon and Microsoft. Markets penalised Alphabet and Amazon for their cash flow, heavy capital expenditure on physical assets such as servers, and cautious forward guidance. When expectations are this high, good results alone are not enough.
The music is still playing
Profits derived from emerging technologies require time to materialise. In the interim, a few signs show that demand remains strong.
- Chip rents. According to Silicon Data’s rental index, leasing an Nvidia H100 chip from specialist cloud providers cost $2.94 an hour on 2 November, an increase from $2.78 on 4 October.
- Order books. Microsoft’s commercial order backlog stands at $677 billion, Google Cloud’s at $561 billion and Amazon Web Services’ at $578 billion. All three corporations state that demand currently exceeds their capacity to build infrastructure.
- Cloud profits. Google Cloud reported an operating profit of $11.1 billion, more than tripling the figure from a year earlier.
- Data-centre space. According to CBRE, only 1.4% of capacity in North America’s primary data-centre markets is currently vacant.
How much of AI profit is technology, and how much is accounting?
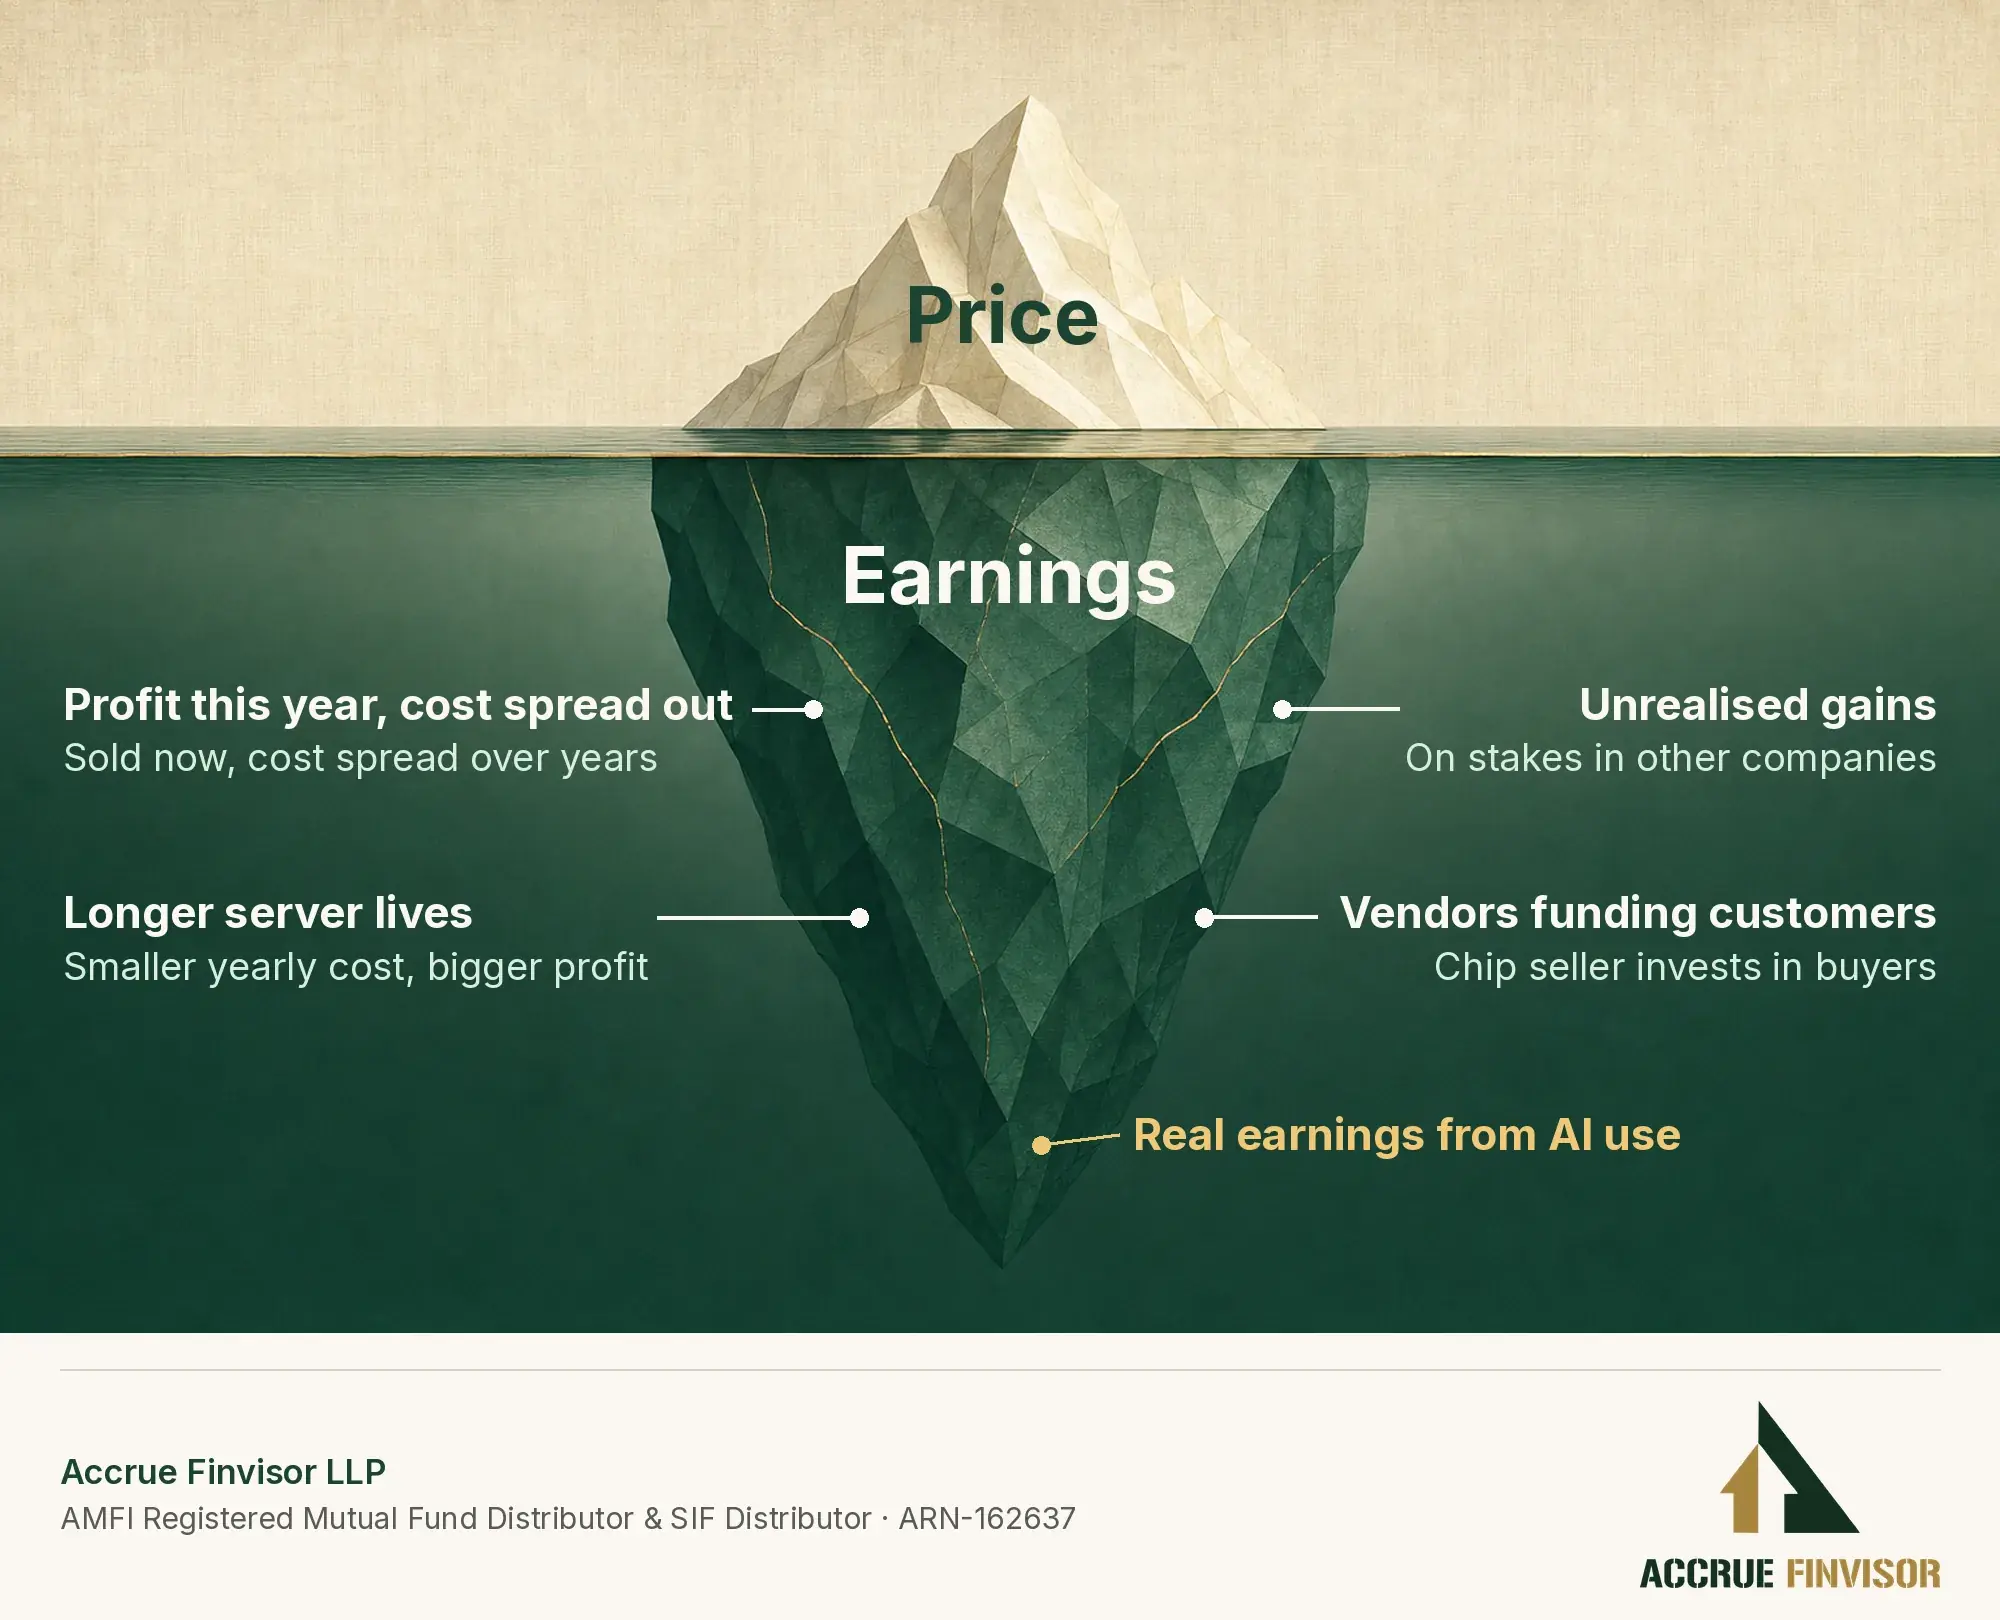
Current AI profitability derives partly from technology sales and partly from accounting treatments. Four factors influence the reported figures.
- Profit this year, cost spread out. When a corporation purchases chips from Nvidia, Nvidia recognises the revenue and profit immediately. The purchaser depreciates the cost over five or six years. Goldman Sachs estimates that almost half of this year’s growth in S&P 500 earnings stems from AI expenditure.
- Longer lives for servers. Microsoft (since 2022), Alphabet (2023) and Meta (2025) have extended the depreciation schedules for their servers. Recognising lower annual costs increases reported profit. At Microsoft, this accounting change added $3.7 billion to operating income in its first year. Conversely, Amazon shortened the useful life of certain servers in 2025.
- Paper gains. Between April and June, Alphabet recorded $98 billion in pre-tax “other income”. This consisted largely of unrealised gains on its holdings in SpaceX and a private company identified by press reports as Anthropic. For comparison, the company generated $40.8 billion in operating profit from its core business. In the subsequent quarter, this line item resulted in an $8.2 billion loss, attributed primarily to SpaceX.
- Money moving in circles. Nvidia invested $2 billion in CoreWeave, a firm that leases Nvidia chips. It also contractually agreed to purchase CoreWeave’s unsold capacity for $6.3 billion. In October, Nvidia announced a $3 billion investment in Meta, which remains one of its largest buyers.
The trajectory of emerging technologies is inherently difficult to forecast, and much of the current optimism comes from the companies selling the technology.
The bottom line
Prior to October, three metrics were near historical peaks: US corporate valuations stood at 255% of the domestic economy, foreign investment in US equities reached a record $22.2 trillion, and the ten largest companies accounted for 40.6% of the S&P 500 index.
These records rest on a single factor: earnings. Investors are relying on those profits continuing to grow by roughly 32.9% in 2026.
With substantial expectations embedded in asset prices, the main risk is that reality falls short. While demand is still strong, a portion of currently reported profits stems from accounting treatments. The question is not whether AI is real, but whether its earnings can catch up with what prices already assume.
Three considerations will indicate whether this is achieved:
- Are AI revenues converting into steady revenue from paying customers?
- Is free cash flow improving after capital expenditure?
- Are earnings estimates rising faster than share prices?

✓ You have finished this 5-minute read
Team Accrue · Accrue Insights
Thank you for reading. We write for investors who want the whole picture, the opportunity and the risk.
This article discusses general market and macroeconomic trends only. It does not recommend, endorse, or provide advice on any specific security, mutual fund scheme, or investment strategy. Companies named are illustrations only, not recommendations. See Accrue's full regulatory disclosures below.
Why did tech stocks fall in October 2026?
Third-quarter results showed the cost of the AI build-out. Revenue kept growing fast, but Alphabet’s free cash flow was negative $9.1 billion in the quarter and Amazon’s negative $42.4 billion over 12 months. The US 10-year yield stayed around 5% and markets priced another Fed rate hike. The Nasdaq 100 fell 6.7% in the month.
Did Chinese and Korean tech stocks fall too?
Yes. Korea’s Kospi fell 16.2% in October and was 37% below its June peak, with SK Hynix down 20.2% in the month. In Hong Kong, the Hang Seng Tech index fell about 12% in October and was about 36% below its January peak. Korean press tied the fall to doubts over the returns on AI spending.
Were the third-quarter results of big tech companies bad?
Mostly not on revenue. Google Cloud grew 103%, AWS 39% and Azure 48%. Results were mixed on other lines: Alphabet missed estimates on revenue and earnings per share, and Meta took a $9.89 billion legal charge. Microsoft beat on every line and its shares barely moved. The market reacted most to cash flow, capex and guidance.
Is demand for AI chips still rising?
Rental prices for Nvidia H100 chips at specialist cloud providers were $2.94 an hour on 2 November, up from $2.78 on 4 October, according to Silicon Data. Microsoft, Google and Amazon all say demand exceeds the capacity they can install, and their order books run to hundreds of billions of dollars.
What is already baked into US tech prices?
The S&P 500 trades at 25.9 times the last 12 months’ earnings against a 10-year average of 23.7, but at 18.7 times expected earnings, close to its 10-year average of 19.1. Analysts expect its earnings to grow 32.9% in 2026. The ten largest companies were 40.6% of the index at the end of September.
Read next
Why Is China’s Stock Market Falling?
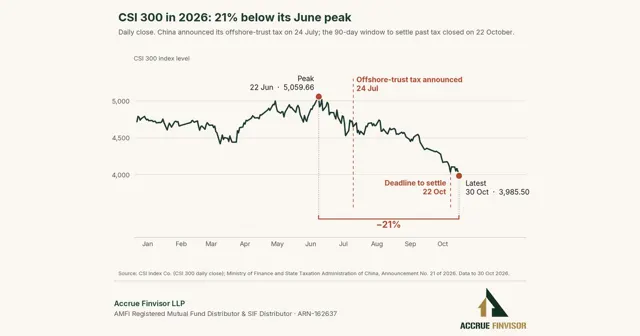
China’s CSI 300 fell 12 weeks in a row to 30 Oct, a record, and is 21% off its peak. The 3 reasons, state buying, and India’s 8-week Nifty fall.
Read the article →Sources (38)
- Alphabet Form 10-K, 2023 (server useful life).
- Meta Form 10-K, 2025 (server useful life).
- Amazon Form 10-K, 2025 (server useful life).
- Nvidia, Nvidia and Meta to expand collaboration, 26 October 2026.
- Meta, pricing of share offerings, October 2026.
- Korea JoongAng Daily, AI spending woes leave Kospi among worst-performing indexes, 20 October 2026.
- Amazon Form 10-Q, quarter to 30 September 2026.
- Alphabet Form 10-Q, quarter to 30 September 2026.
- Accrue Insights: Why Is China’s Stock Market Falling?.
- Alphabet Q3 2026 results, CNBC, 29 October 2026.
- Silicon Data, H100 rental index (neo-cloud), 2 November 2026.
- Microsoft Form 10-K, fiscal 2023 (server useful life change).
- Hang Seng TECH Index, estimated from the Hang Seng TECH ETF (3032.HK) daily closes.
- Korea Exchange, KOSPI.
- Nasdaq 100 and stock closing prices, 30 September to 30 October 2026 (Nasdaq; company share prices).
- CNBC, AI buildout hits snag as Google and Microsoft put off raising capex forecasts, 29 October 2026.
- CNBC, Treasury yields and the Federal Reserve, 28 October 2026.
- CNBC, AI debt and hyperscaler earnings, 27 October 2026.
- US Treasury, 10-year constant maturity yield, via FRED.
- Federal Reserve, Financial Accounts of the United States (Z.1): non-financial corporate equity, via FRED.
- Federal Reserve Z.1: rest of the world’s holdings of US corporate equities, via FRED.
- MSCI ACWI Index factsheet, 30 September 2026.
- IMF World Economic Outlook database, GDP in US dollars.
- J.P. Morgan Asset Management, Guide to the Markets, 4Q 2026.
- FactSet Earnings Insight, 30 October 2026.
- Kotak Mutual Fund, AI vs ex-AI earnings growth (data: FactSet, Jefferies).
- Jefferies on AI earnings growth, Business Today, 17 October 2026.
- Goldman Sachs on AI spending and S&P 500 earnings growth, as reported by Yahoo Finance, September 2026.
- Microsoft FY27 Q1 earnings release.
- Alphabet Q3 2026 CEO remarks.
- Alphabet Q2 2026 earnings release (SEC).
- Fortune, Google’s biggest-ever profit quarter came from Anthropic and SpaceX stakes, 22 July 2026.
- Alphabet Q3 2026 earnings release (SEC).
- Amazon Q3 2026 earnings release (SEC).
- Meta Q3 2026 earnings release and October 2026 prospectus supplement (SEC).
- CBRE, North American data center report, H1 2026.
- Nvidia, Nvidia and CoreWeave strengthen collaboration, 26 January 2026.
- CoreWeave Form 8-K, 9 September 2025 (Nvidia capacity agreement).