Why Are Foreign Investors Rushing to Buy India? 3 Reasons
“…in the real world, things generally fluctuate between ‘pretty good’ and ‘not so hot.’”

After two years of historic foreign outflows and domestic underperformance, a sudden wave of November buying has investors asking why.
For information and education only. Not investment advice, and not research for the purpose of investment.
In the first eight trading sessions of November 2026, foreign investors poured a net Rs 79,833 crore into Indian equities. To put that number in perspective against NSDL data since 2002, December 2023 and December 2020 garnered Rs 66,135 crore and Rs 62,016 crore.
This has come after two years of skepticism and pessimism on India, but now, suddenly, money is re-entering Indian markets. There are three distinct reasons for this. Beneath these wild swings in market expectations, underlying corporate earnings expanded.
The Bottom Line:
- The Valuation Disconnect: The Nifty 500’s trailing EPS rose 22.4% while its price index drifted lower. This divergence compressed the Nifty 500 P/E to 22.3, dropping it below its post-April 2021 average.
- The Global Rotation: The global AI trade cracked and oil prices retreated. This shifted capital away from tech-heavy indices, and FPI data shows capital returning to India.
- The Ownership Data: Foreign ownership of NSE-listed companies fell to a 17-year low of 15.1% in June 2026.
The Context: India Lagged Emerging Markets
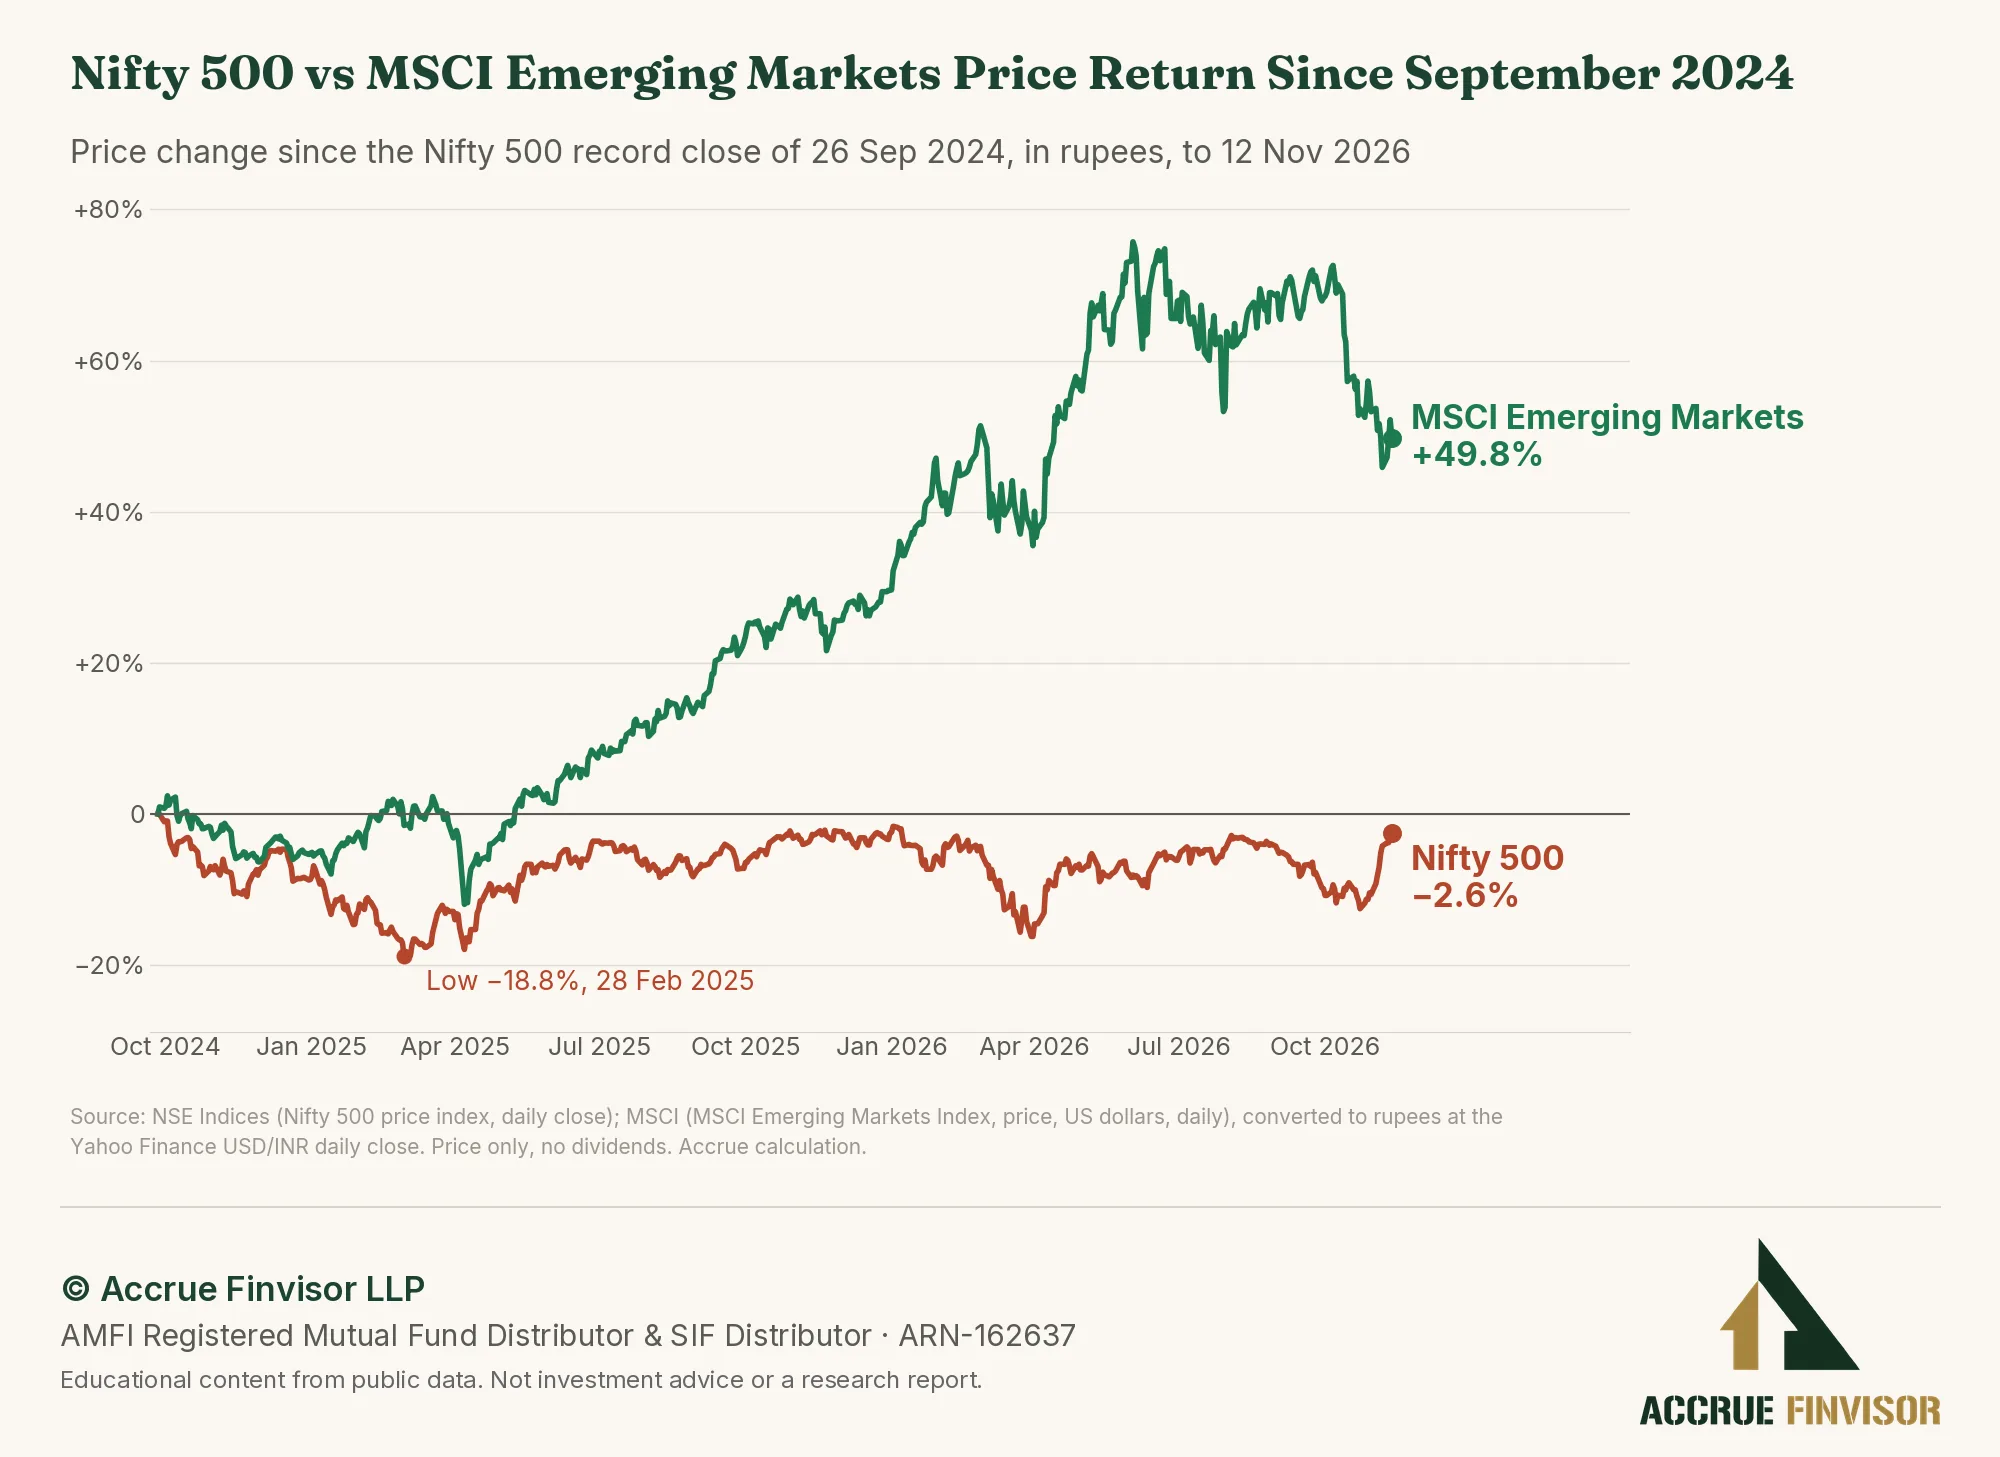
Investors in Indian equities suffered a double whammy as external sentiment shifted. They made no money in India, while other emerging markets delivered significant returns. This was especially frustrating for NRI and foreign investors navigating a falling currency.
Between 26 September 2024 and 12 November 2026, the rupee weakened from 83.70 to reach a low of roughly 96.8 per US dollar on 20 May 2026. It then recovered to 93.77 on 12 November 2026. Because of the rupee’s fall, while the Nifty 500 fell 2.6% in rupees, it plunged 13.0% in US dollars.
Over that exact same period, from 26 September 2024 to 12 November 2026, the MSCI Emerging Markets Index surged 49.8%. This comparison is measured in rupees, considering price change only.
Between January and October 2026, foreign institutions pulled a net Rs 2,95,145 crore out of Indian equities. Meanwhile, the paths of the two indices diverged wildly.
The Nifty 500 dropped to a low of -18.8% on 28 February 2025. In stark contrast, the MSCI Emerging Markets Index climbed to a peak gain of 75.7% on 2 June 2026.
Reason 1: The Global AI Trade Cracked
The primary reason for India losing money was the global AI trade. Reuters reported on 5 November that India’s relative lack of AI-linked stocks kept investors away. For much of the previous two years, global capital concentrated in AI-linked markets. This heavily rewarded semiconductor regions while ignoring Indian businesses.
Many institutional investors allocate funds based on the weightings of major indices. By 30 October 2026, information technology made up 41.77% of the MSCI Emerging Markets Index. Taiwan held a 28.88% country weight and South Korea held 19.66%.
India, by contrast, held an 11.73% weight in the index. As India offered little exposure to the prevailing global AI narrative, foreign investors largely kept moving their capital away.
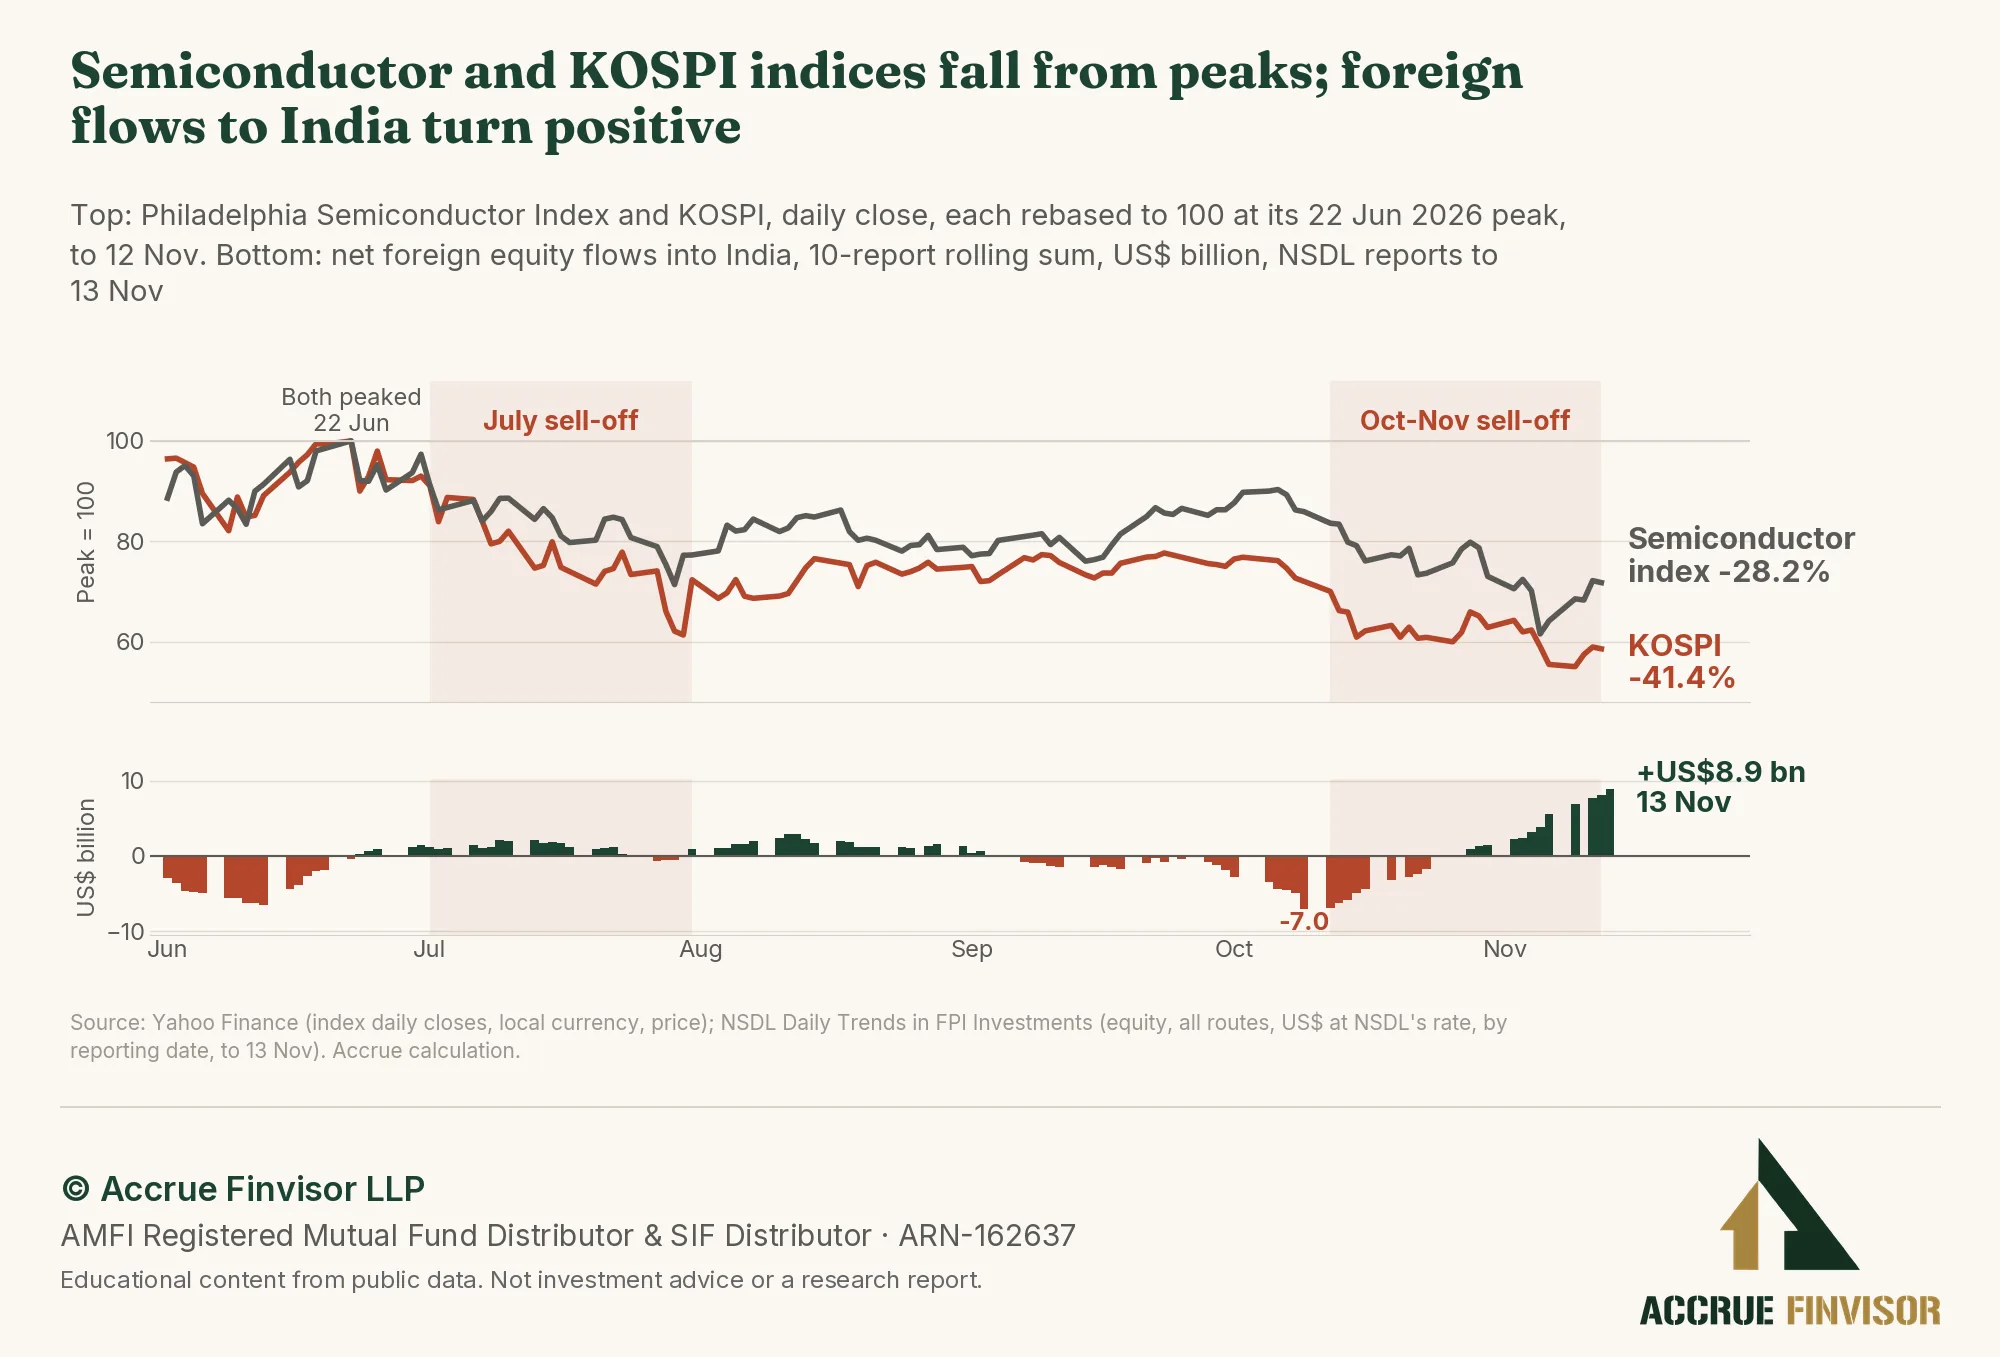
This dynamic shifted abruptly when the AI trade cracked, a shift we covered in our 3 November note, Is the AI Bubble Bursting? October’s Sell-Off and the Question of AI Earnings. From their 22 June peaks to 12 November, Korea’s KOSPI fell 41.4% and the Philadelphia Semiconductor Index declined 28.2%.
October and November brought a heavy sell-off across Asia. From 30 September 2026, Korea’s KOSPI fell 21.9% to 12 November, and Taiwan’s TAIEX dropped 10.1%. China’s CSI 300 also faced selling pressure, declining 6.5% by 11 November.
When momentum in a dominant global trade breaks, institutional flow data shows capital moving elsewhere. As competing tech regions faced heavy selling, foreign institutional capital quickly re-entered Indian equities.
Reason 2: Oil Retreated From Its Peak
Market expectations also swung wildly based on global energy shocks. India imported 88.7% of the crude it consumed in the 2025-26 financial year, making it highly vulnerable to price spikes. As Brent crude surged from US$71.32 in late February to US$121.88 by late March, Indian equities suffered.
The Nifty 500 price index fell 11.4% during this phase to reach its 2026 low. This inverse relationship between crude and Indian equities persisted as the year progressed. When Brent crude eased back to US$68.53 by July, the domestic market recovered.
The Nifty 500 climbed 16.0% between late March and early August as energy pressures temporarily subsided. However, tensions escalated again in September, causing Brent crude to climb back toward US$128.12 by late October. Indian equities faced brutal selling pressure, dropping 10.0% from early August to late October.
By mid-November, Brent crude retreated to US$92.14 as supply flows largely recovered. As oil fell 28% from its October high, the Nifty 500 rose 11.4% from its 23 October low. Reuters reported on 9 November that Citi estimates a US$10 per barrel drop in crude lifts Nifty earnings per share by roughly 2%.
Reason 3: Has India Become Cheap?
While external events caused market sentiment to swing wildly, domestic corporate earnings expanded. The wider economy’s indicators were also growing, with 88% of 50 tracked metrics showing high or moderate growth in Q2 FY27. The price diverged from earnings growth. Between 26 September 2024 and 12 November 2026, the Nifty 500 price index fell 2.6%.
Yet, its trailing earnings per share rose 22.4% over the same period. Short-term volatility and changing global expectations temporarily obscured this fundamental corporate growth.
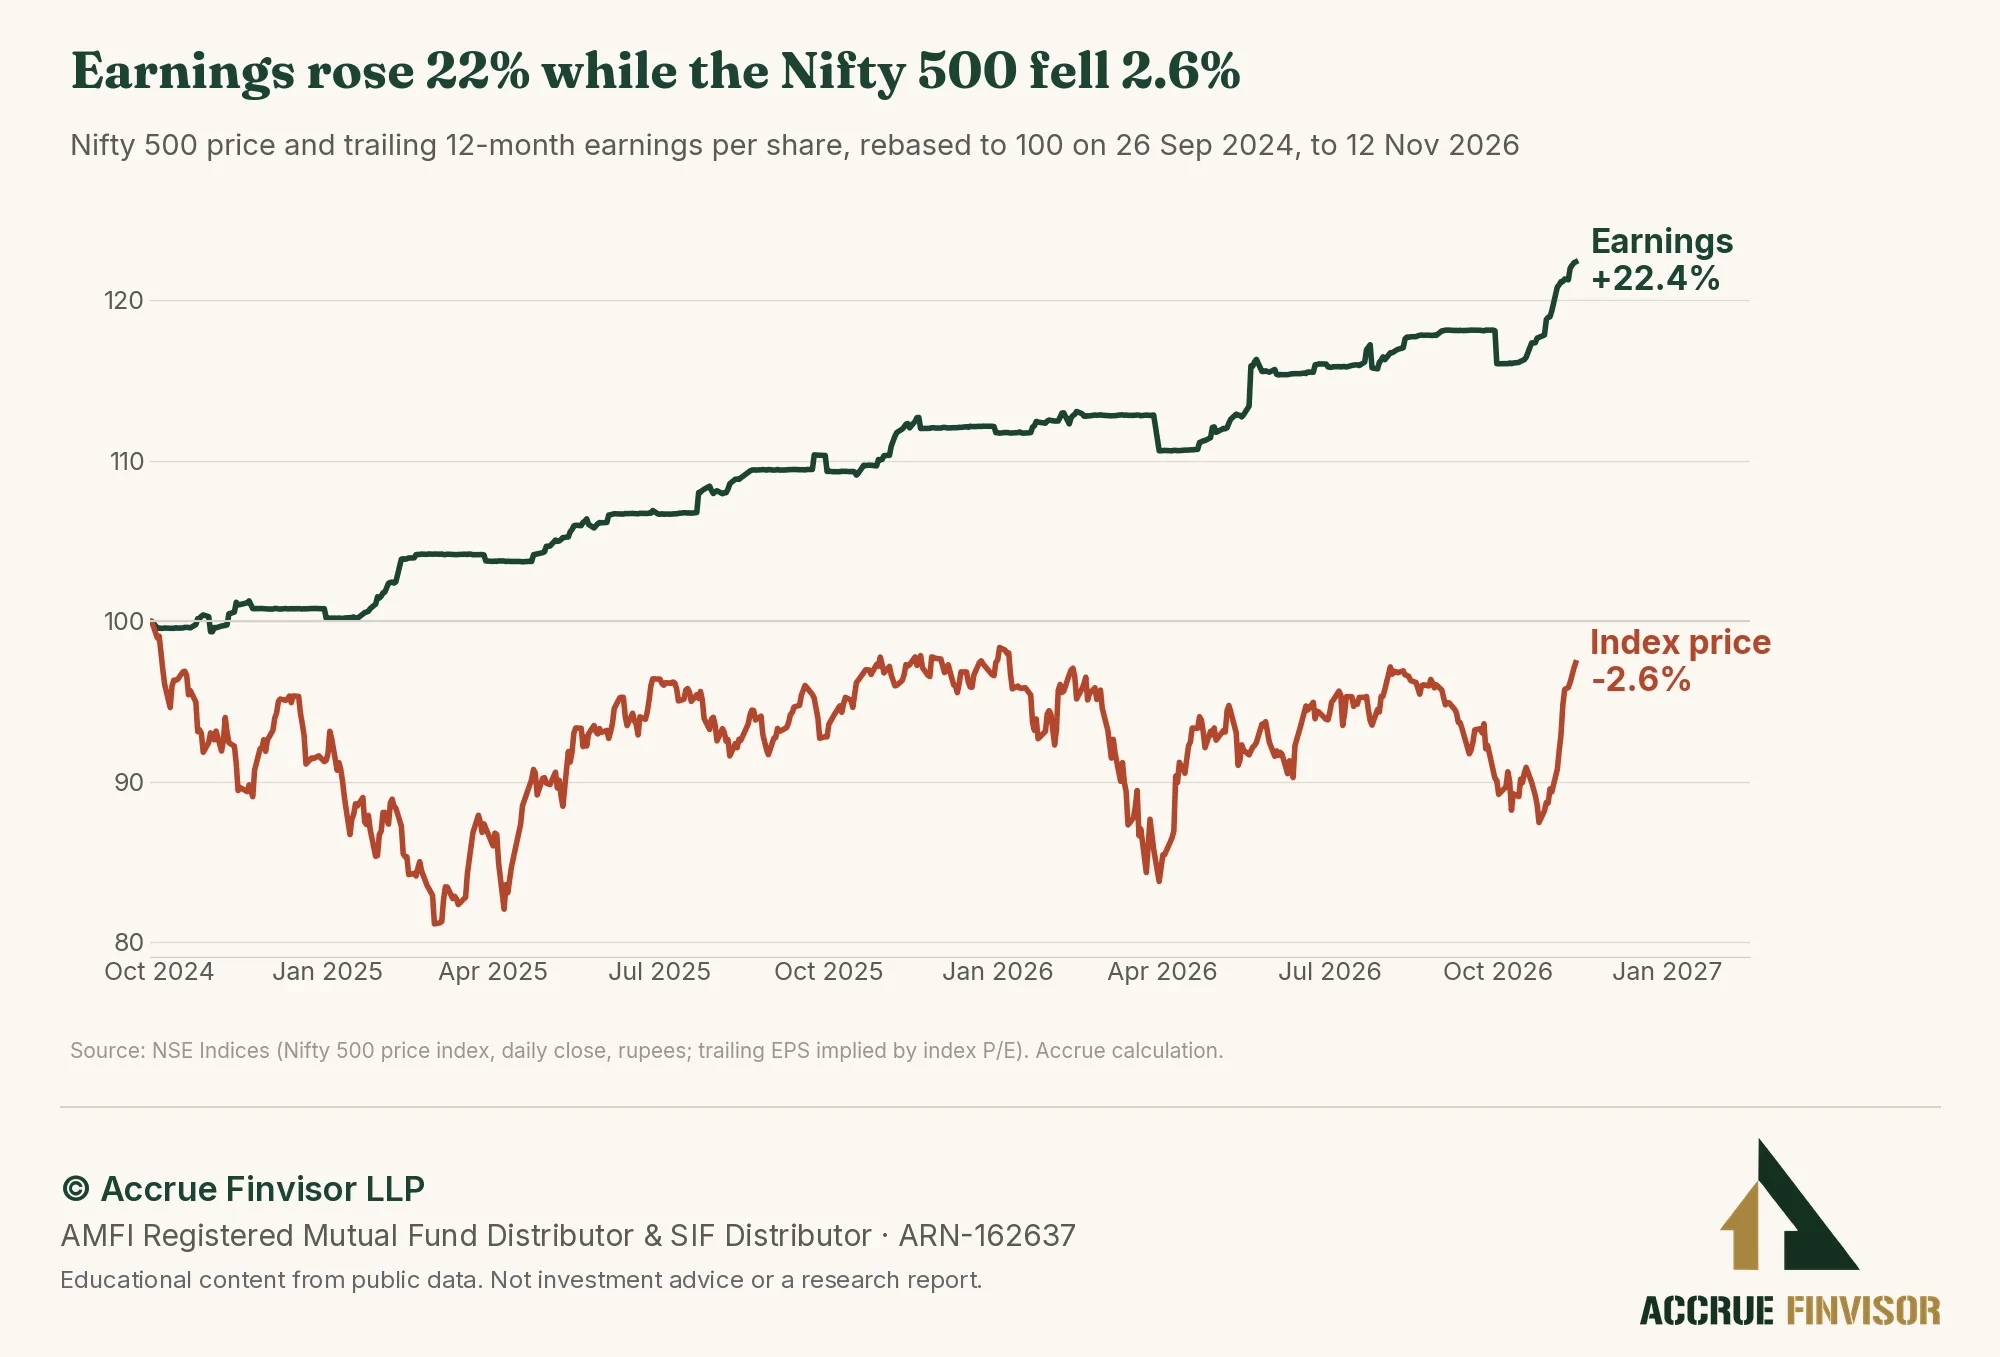
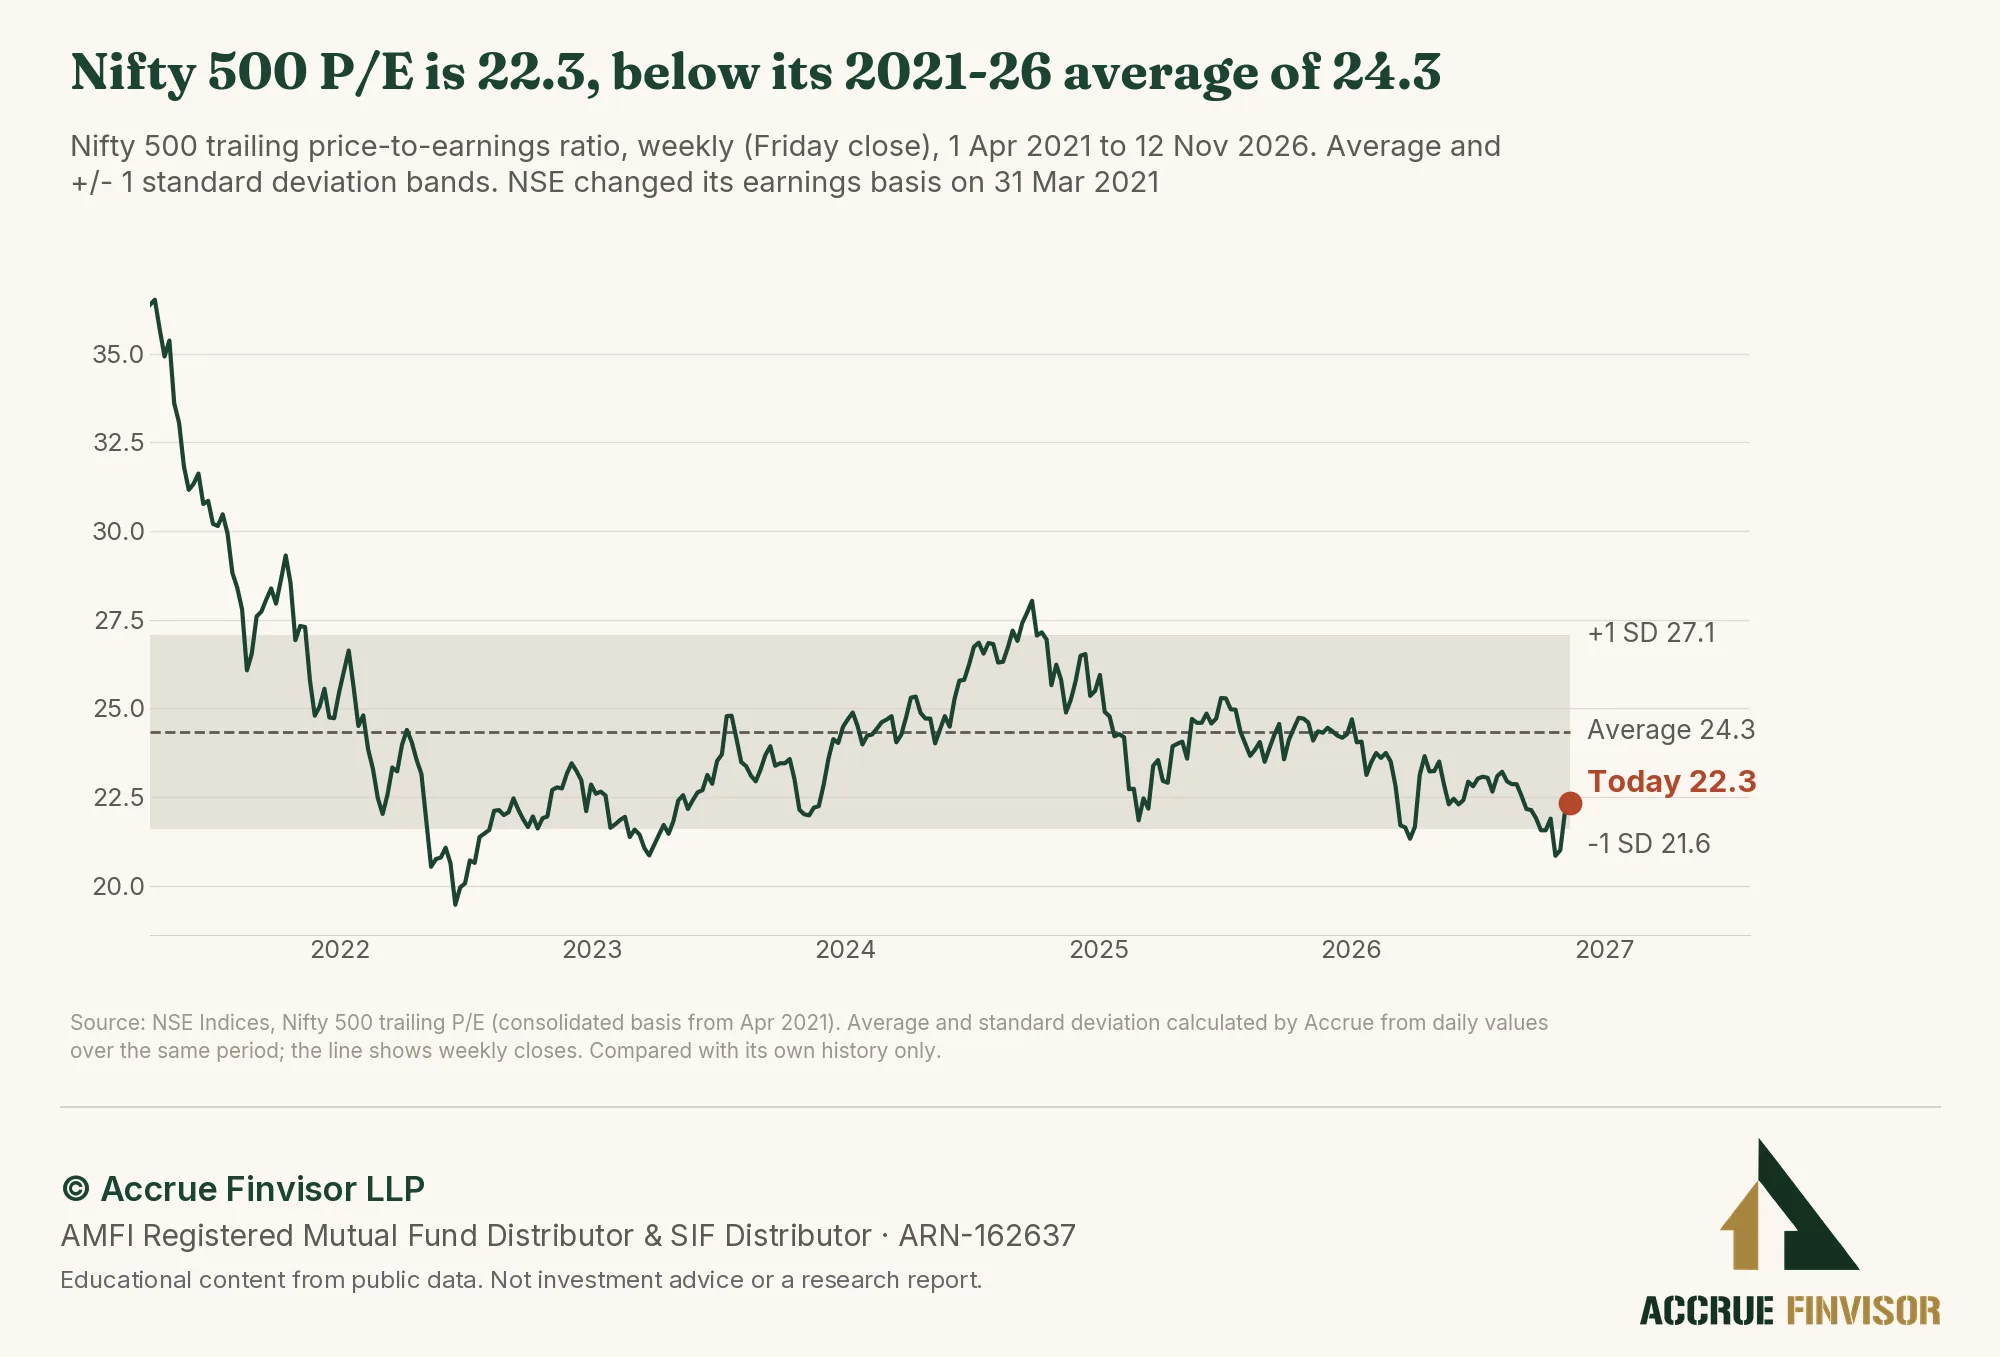
Because corporate earnings steadily rose while the index drifted lower, valuations compressed. The trailing P/E dropped from 28.0 on 26 September 2024 to 22.3 by 12 November.
At 22.3, the trailing P/E is above its long-term average of 20.8 since 1996 and below its post-April 2021 average of 24.3. The NSE changed its P/E calculation basis in March 2021.
Simultaneously, the two-year exodus reduced foreign portfolios of Indian stocks. Foreign ownership of NSE-listed companies dropped to 15.1% by June 2026, which the NSE called a 17-year low.
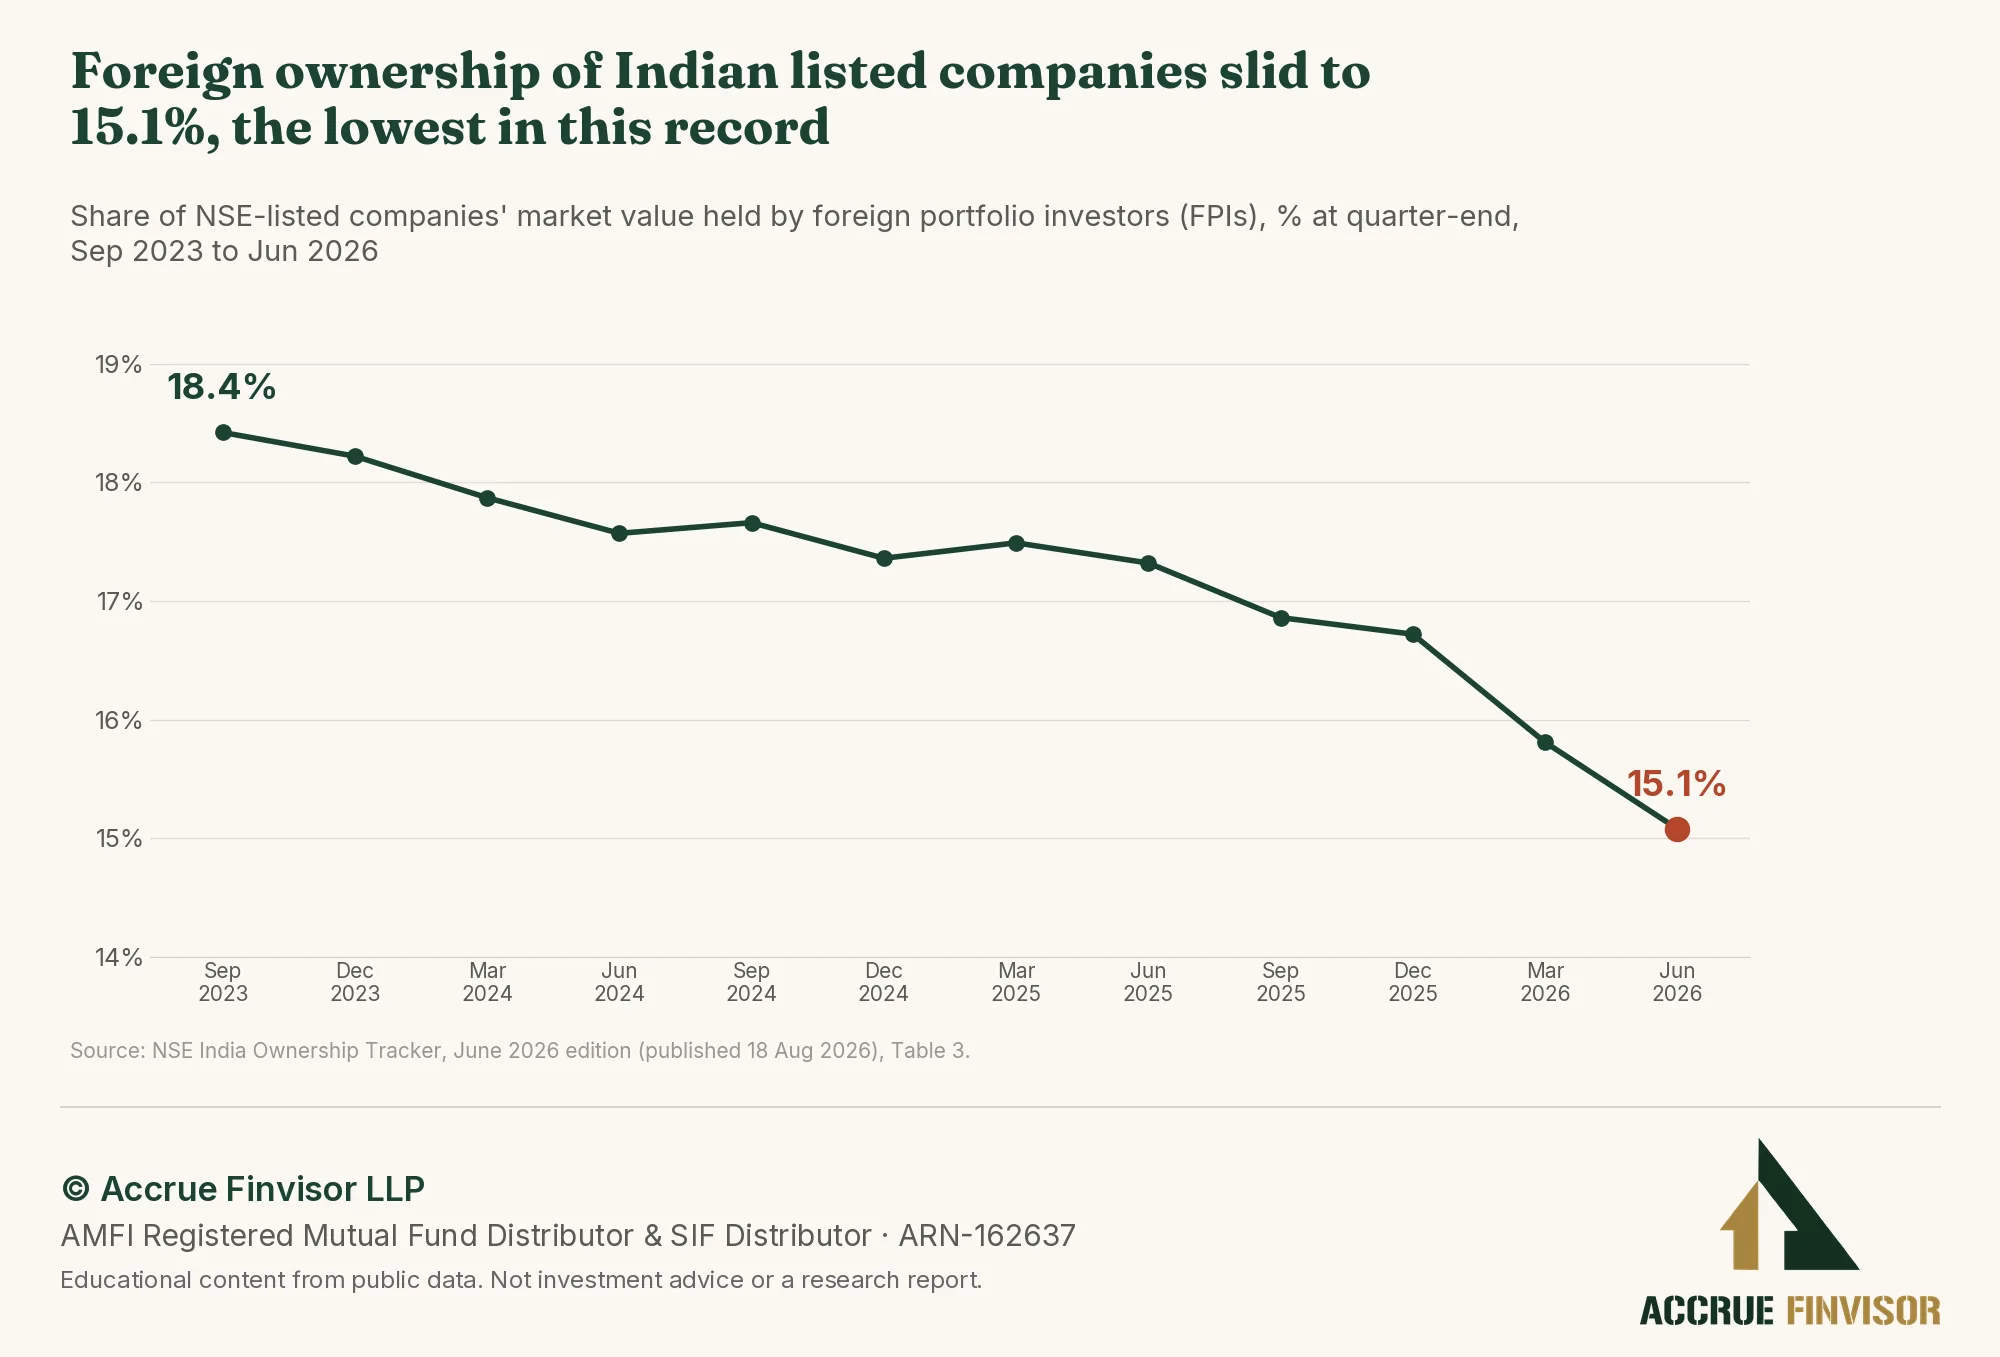
From this reduced baseline, flows data shows fresh capital entering as global pressures eased. Ultimately, foreign capital returned because oil corrected, competing tech markets sold off, and Indian valuations fell.
Conclusion
Two years ago, in 2024, Indian equities were pretty good in absolute and relative terms compared with other emerging markets. In calendar 2023, the Nifty 500 rose 25.8% while the MSCI Emerging Markets Index rose 6.4% in rupees. Between 29 December 2023 and 26 September 2024, the Nifty 500 gained a further 26.1% against 15.5% for the emerging market index.
After this peak followed a long period where the market moved to the not-so-hot category. Geopolitics remains a persistent external threat, and the AI trade could also suddenly regain momentum. In times of heightened geopolitical trouble and ongoing technological transition, volatility runs higher.
Long-term returns are ultimately determined by long-term corporate earnings growth.

✓ You have finished this 5-minute read
Team Accrue · Accrue Insights
Thank you for reading. We write for investors who want the whole picture, the opportunity and the risk.
This article discusses general market and macroeconomic trends only. It does not recommend, endorse, or provide advice on any specific security, mutual fund scheme, or investment strategy. Companies named are illustrations only, not recommendations. See Accrue's full regulatory disclosures below.
Why did foreign investors buy Indian equities in November 2026?
Foreign capital returned as Brent crude retreated from its peak and the global AI trade cracked. At the same time, the Nifty 500’s trailing P/E fell to 22.3, dropping below its post-April 2021 average of 24.3. Foreign ownership of NSE-listed companies had also fallen to a 17-year low of 15.1% by June 2026.
How much did foreign institutions buy and sell in 2026?
Between January and October 2026, foreign institutions pulled a net Rs 2,95,145 crore out of Indian equities. This reversed in early November, with NSDL reporting net foreign portfolio investor equity buying of Rs 79,833 crore in the first eight trading sessions.
How did Indian equities perform compared to emerging markets from 2024 to 2026?
From the Nifty 500’s record close on 26 September 2024 to 12 November 2026, Indian equities showed underperformance. In rupee price terms, the Nifty 500 fell 2.6% while the MSCI Emerging Markets Index surged 49.8%.
Why did the Nifty 500 price fall while earnings grew?
Between 26 September 2024 and 12 November 2026, the Nifty 500’s trailing earnings per share rose 22.4%. However, the price index fell 2.6% over the same period. This divergence caused the index’s trailing P/E to drop from 28.0 to 22.3.
What was the AI trade and how did it impact India?
Global capital concentrated in AI-linked markets, leaving information technology to make up 41.77% of the MSCI Emerging Markets Index by 30 October 2026. Reuters reported that India’s relative lack of AI-linked stocks kept investors away. HDFC Bank was its only top-10 stock in the MSCI index. The trade cracked when indices like the Philadelphia Semiconductor Index and Korea’s KOSPI sold off sharply.
More questions
What is the current Nifty 500 P/E valuation?
By 12 November 2026, the trailing Nifty 500 P/E dropped to 22.3. This valuation compressed from 28.0 in September 2024, placing the index below its post-April 2021 average of 24.3, though it remains above its long-term average of 20.8 since 1996.

Read next
The India Paradox: Surging Economy, Sliding Markets
FIIs are fleeing and the rupee is down, but GDP is growing at 7.8% and credit at 19.4%. A look at how domestic momentum is withstanding external headwinds.
Read the article →Sources (19)
- NSDL, FPI Monitor: daily trends in FPI investments.
- NSDL, FPI Monitor: monthly FPI net investment by calendar year.
- NSE Indices, Nifty 500 historical data (price index and P/E).
- MSCI, MSCI Emerging Markets Index factsheet, 30 October 2026.
- MSCI, end-of-day index data (MSCI Emerging Markets, price, US dollars).
- NSE, India Ownership Report, June 2026.
- Federal Reserve H.10 via FRED, rupees per US dollar (DEXINUS).
- RBI, reference rate archive.
- EIA via FRED, Brent crude spot price (DCOILBRENTEU).
- PPAC, Snapshot of India’s Oil and Gas data.
- IEA, Oil Market Report, March 2026.
- CNBC, oil prices and Iran, 10 November 2026.
- CNBC, oil prices, 12 November 2026.
- CBS News, Iran war live updates, 10 November 2026.
- Reuters via MarketScreener, India stocks draw biggest foreign inflow in nearly six years, 5 November 2026.
- Business Standard (Reuters), Citi bullish on Indian equities, 9 November 2026.
- China Securities Index Co., CSI 300 Index.
- Yahoo Finance, KOSPI, TAIEX and Philadelphia Semiconductor Index daily closes.
- Oaktree Capital, Howard Marks memo, On the Couch, January 2016.